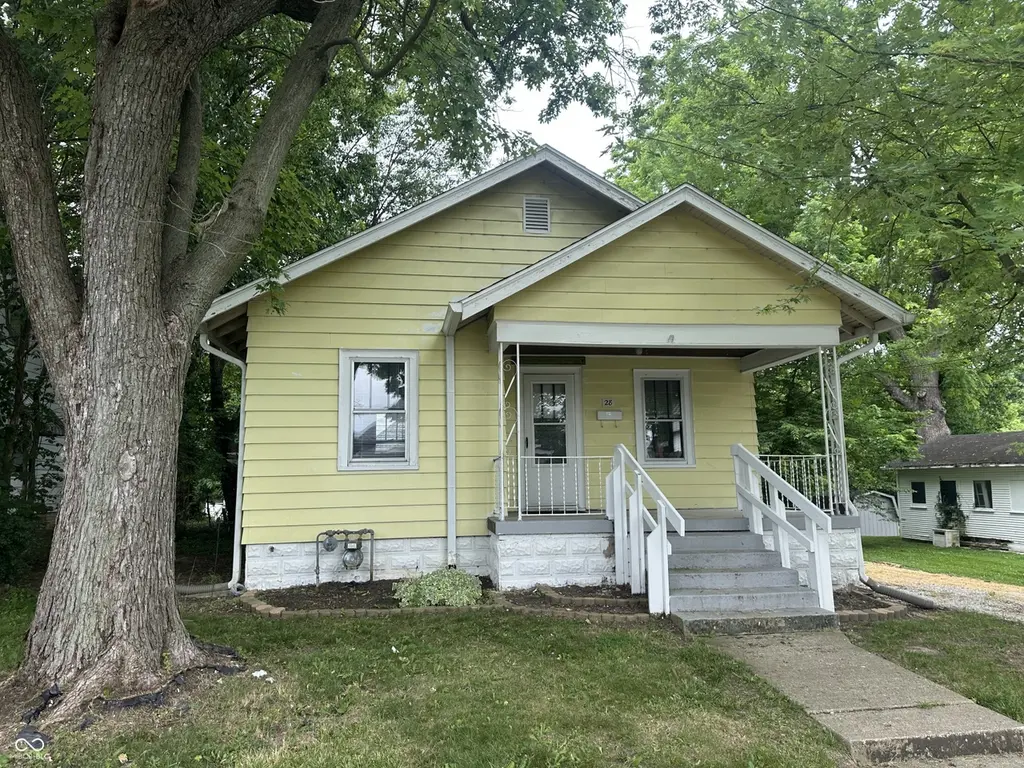
28 Beveridge
Greencastle, IN 46135
$159,900D
2 bd · 1.0 ba ·
775 sqft ·
Built 1932
· SingleFamily
· Active
· 9 DOM
Cashflow @ list (25.0% down · 7.5%)
Estimated rent
$1,216/mo
Mortgage (P&I)
−$839
Tax + insurance
−$101
HOA
−$0
Vac / Maint / Mgmt
−$255
Net cashflow
$21/mo
Annual
$246/yr
Cap rate
6.45%
Cash-on-cash
0.55%
DSCR
1.02
1% rule
0.76%
Cash to close
$44,772
Investor read
- This is a 2-bed/1.0-bath single-family listed at $160k.
- At list price, monthly cash flow is $21 ($246/yr) — positive.
- The deal already cash-flows at list — no discount required.
- To meet the 1% rule (rent ≥ 1% of price), the offer needs to be $122k (24.0% below list).
- Only 9 days on market — expect competitive offers; lowballing is unlikely to land.
- Recommended offer: $122k (24.0% below list) — sets the bar for 1% rule.
- Local home prices are declining (-3.0%/yr); year-one equity from $1k of loan paydown is wiped out by about $5k of value loss. Plan a longer hold.
- Location reads 73/100 on livability (#108 in IN) — a middle-class / working-renter tenant base. Strengths: cost of living A+, housing A+; Watch: employment C-, amenities F, commute F.
- Greencastle Community School Corporation (town): math 38% / reading 42% proficiency, ranked #145 of 301 in IN (top 48%) — families likely to look elsewhere, expect single-tenant / working-renter base with shorter leases.
- Zoned schools: Martha J Ridpath Elementary School (199 students, 70% FRL); Greencastle High School (math 42% / reading 67%, grade C-, #79 of 369 statewide, top 26%, 498 students, 49% FRL) — zoned schools average 60% FRL vs 38% district-wide (22 pts higher); higher-poverty schools than district average — tighter screening recommended.
- Zoned-school proficiency averages 54% at this address vs 40% district-wide (+14 pts) — the actual schools serving this property are materially stronger than the Greencastle Community School Corporation average implies; a family-tenant draw the district grade alone would hide.
- Watch-outs: built in 1932 — expect roof / HVAC / electrical / plumbing capex.
- Market conditions: 97 active listings in the ZIP; 166 units permitted in Putnam County in 2024 (0 in 5+ unit buildings).
- Putnam County population projected to shrink 8% by 2050 — rents likely to lag national; underwrite the cash flow, not the appreciation.
- Cap rate 6.4% vs local median 4.3% in Greencastle — top-decile yield for the area; either an underpriced asset or a hidden risk that comps aren't pricing in. Stress-test before assuming the spread holds.
Questions for listing agent
- Built in 1932 — when were the roof, HVAC, electrical panel, plumbing, and water heater last replaced?
- Is there a deadline driving the sale (1031 exchange, divorce, estate, relocation)? That informs how much negotiation room exists.
- The area grade is low — what's the realistic commute time and amenity access for the typical tenant pool here? Any planned neighborhood developments (good or bad) we should know about?
- What's the average days-on-market for RENTAL listings here right now (not sales)? A rising rental-DOM trend means longer vacancies and softer asking-rent achievability than the comps imply.
- What's the recent tenant-quality profile in this submarket — average credit score on applications, eviction rate, late-payment / NSF rate, and stable-employment percentage? A property-management company in the area should have these aggregated.
- How much new for-sale + rental construction is in the pipeline within 1–3 miles? Heavy new supply typically softens prices + rents 12–24 months out; constrained supply supports both.
CashFlowRE · CFR-C9NE0FAQ0NF9PC
· Data 2 days ago
cashflowre.app · 2026-05-29