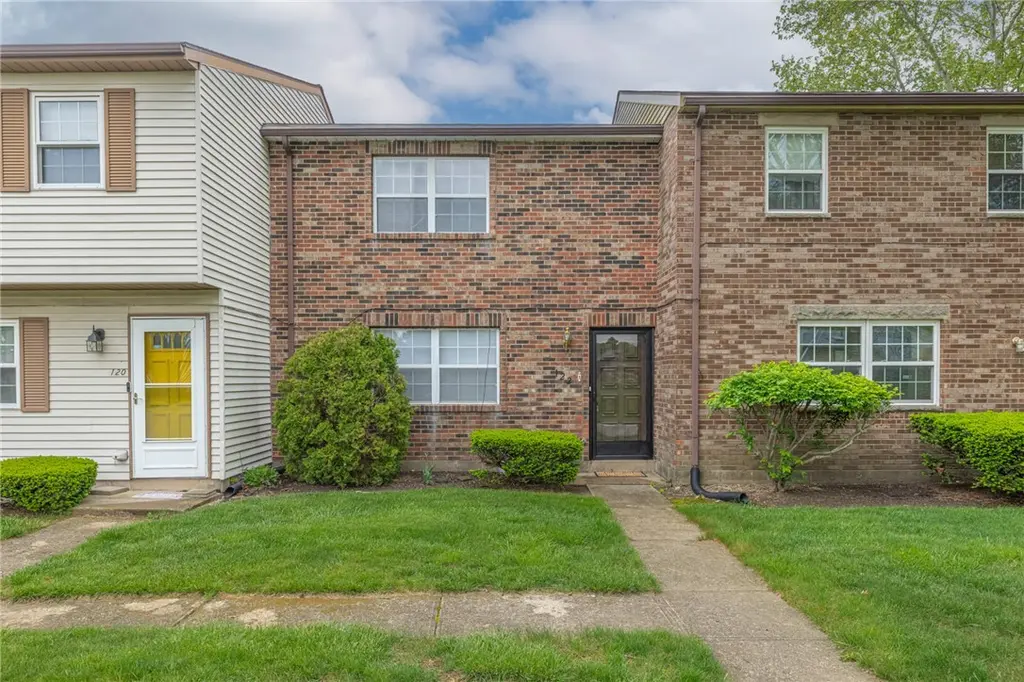
122 Commons Ave
Englewood, OH 45322
$115,000B-
2 bd · 1.5 ba ·
1,080 sqft ·
Built 1973
· Townhouse
· Active
· 46 DOM
Cashflow @ list (25.0% down · 7.5%)
Estimated rent
$1,570/mo
Mortgage (P&I)
−$603
Tax + insurance
−$217
HOA
−$225
Vac / Maint / Mgmt
−$330
Net cashflow
$195/mo
Annual
$2,337/yr
Cap rate
8.33%
Cash-on-cash
7.26%
DSCR
1.32
1% rule
1.37%
Cash to close
$32,200
Investor read
- This is a 2-bed/1.5-bath townhouse listed at $115k.
- At list price, monthly cash flow is $195 ($2k/yr) — positive.
- The deal already cash-flows at list — no discount required.
- Meets the 1% rule at list price ($2k rent vs $115k).
- It's been on market 46 days — a 3% lower offer ($112k) is reasonable based on typical stale-listing flexibility.
- Recommended offer: $112k (3.0% below list) — sets the bar for market timing.
- Local home prices are declining (-3.0%/yr); year-one equity from $795 of loan paydown is wiped out by about $3k of value loss. Plan a longer hold.
- Location reads 69/100 on livability (#517 in OH) — a middle-class / working-renter tenant base. Strengths: cost of living A+, housing A+; Watch: employment C-, amenities F, commute F.
- Northmont City (suburban): math 52% / reading 62% proficiency, ranked #318 of 656 in OH (top 48%) — acceptable for families but not a draw, mixed tenant base, ~2y average lease.
- Zoned schools: Kleptz Early Childhood Learning Center (833 students, 34% FRL); Northmont Middle School (math 47% / reading 58%, grade C+, #378 of 654 statewide, top 59%, 777 students, 37% FRL); Northmont High School (math 37% / reading 64%, grade D+, #380 of 781 statewide, top 49%, 1,392 students, 34% FRL).
- Market conditions: Rents soft (-0.5%/yr); 90 active listings in the ZIP; 11 comparable units currently listed for rent nearby; rentals at typical pace (median 17d on market — plan ~3-4 weeks tenant-placement turnaround); solid renter incomes; 907 units permitted in Montgomery County in 2024 (416 in 5+ unit buildings).
- Montgomery County population projected at -10% by 2050 — secular population decline; favor cash flow + early exit over multi-decade hold.
- 3 sale attempts since 2y ago; this cycle's ask has dropped $7k (6%) from the opening price — seller is motivated, your offer sets the floor, not the list.
- Cap rate 8.3% vs local median 5.3% in Englewood — top-decile yield for the area; either an underpriced asset or a hidden risk that comps aren't pricing in. Stress-test before assuming the spread holds.
Questions for listing agent
- It's been on market 46 days. Have you received any prior offers? Is the seller open to a 3% concession, seller financing, or rate buy-down credit?
- Built in 1973 — when were the roof, HVAC, electrical panel, plumbing, and water heater last replaced?
- What does the HOA fee cover, when was the last increase, and are there any pending special assessments or reserve-fund shortfalls?
- Is there a deadline driving the sale (1031 exchange, divorce, estate, relocation)? That informs how much negotiation room exists.
- Schools are A-rated — typically a magnet for longer-tenancy family renters. What's the average tenant stay here, and is there a school-zone premium baked into asking?
- What's the average days-on-market for RENTAL listings here right now (not sales)? A rising rental-DOM trend means longer vacancies and softer asking-rent achievability than the comps imply.
- What's the recent tenant-quality profile in this submarket — average credit score on applications, eviction rate, late-payment / NSF rate, and stable-employment percentage? A property-management company in the area should have these aggregated.
- How much new for-sale + rental construction is in the pipeline within 1–3 miles? Heavy new supply typically softens prices + rents 12–24 months out; constrained supply supports both.
CashFlowRE · CFR-CA8JJW9SRGTXHW
· Data 1 day ago
cashflowre.app · 2026-05-29