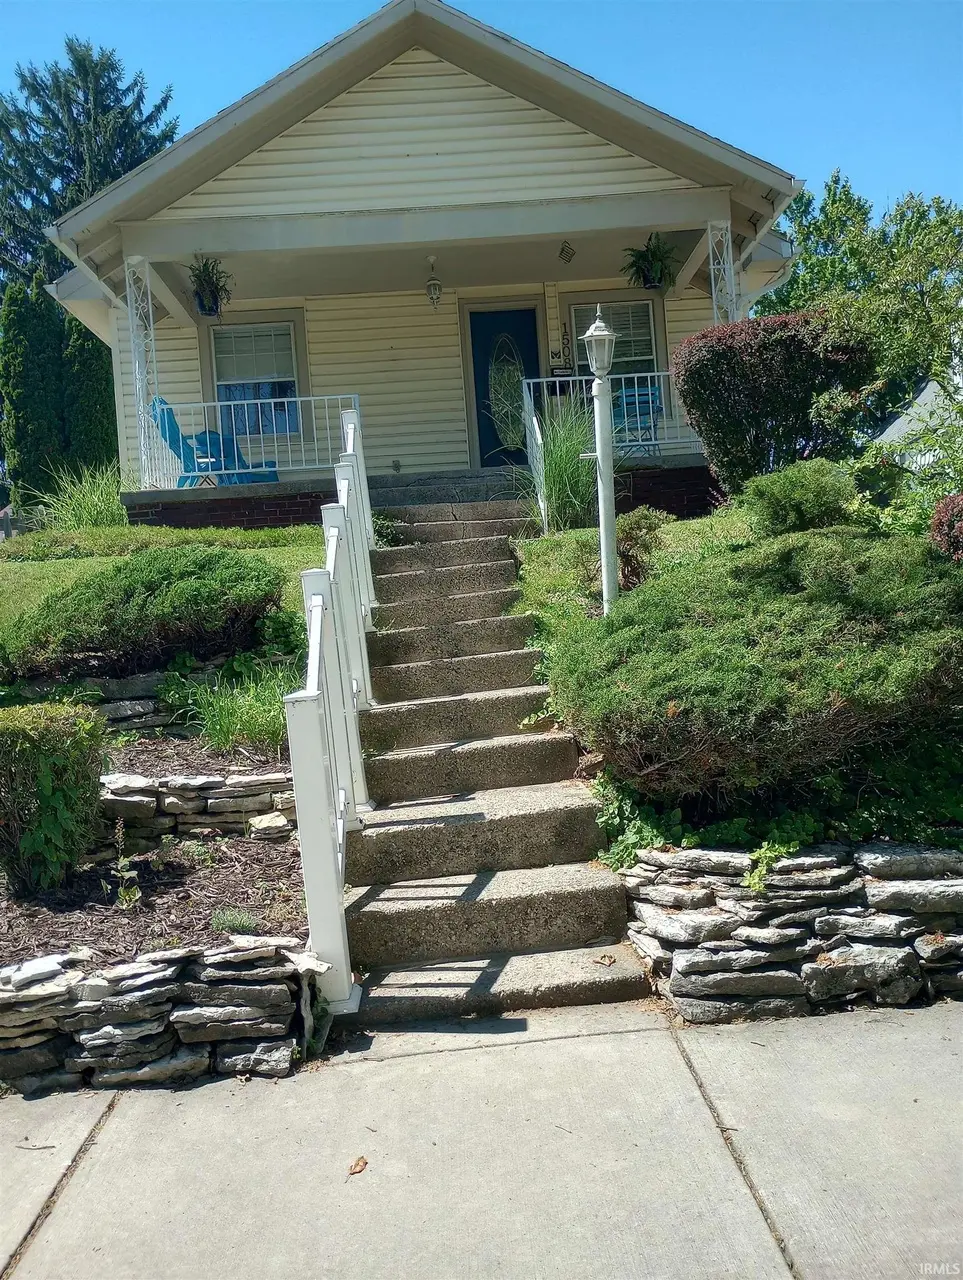
1508 Strand Rd
Fort Wayne, IN 46808
$189,900F
2 bd · 1.5 ba ·
936 sqft ·
Built 1930
· SingleFamily
· Active
· 6 DOM
Cashflow @ list (25.0% down · 7.5%)
Estimated rent
$1,155/mo
Mortgage (P&I)
−$996
Tax + insurance
−$196
HOA
−$0
Vac / Maint / Mgmt
−$243
Net cashflow
$-279/mo
Annual
$-3,350/yr
Cap rate
4.53%
Cash-on-cash
-6.30%
DSCR
0.72
1% rule
0.61%
Cash to close
$53,172
Investor read
- This is a 2-bed/1.5-bath single-family listed at $190k.
- At list price, monthly cash flow is $-279 ($-3k/yr) — negative.
- To cash-flow at today's rent, offer at most $141k (26.0% below list).
- To meet the 1% rule (rent ≥ 1% of price), the offer needs to be $116k (39.2% below list).
- Only 6 days on market — expect competitive offers; lowballing is unlikely to land.
- Recommended offer: $116k (39.2% below list) — sets the bar for 1% rule.
- Local home prices are declining (-3.0%/yr); year-one equity from $1k of loan paydown is wiped out by about $6k of value loss. Plan a longer hold.
- Location reads 84/100 on livability (#6 in IN, #676 nationally) — a professional / high-income tenant draw. Strengths: amenities A+, commute A+, cost of living A+; Watch: crime C-, employment D+.
- Fort Wayne Community Schools (urban): math 22% / reading 29% proficiency, ranked #263 of 301 in IN (top 87%) — low school quality limits family demand, transient renter base, plan for 1-2y turnover; 60% free/reduced lunch — lower-income household profile, screen leases tightly.
- Zoned schools: Francis M Price Elementary School (math 26% / reading 22%, grade F, #781 of 994 statewide, top 79%, 469 students, 67% FRL); Northwood Middle School (math 14% / reading 22%, grade F, #279 of 330 statewide, top 86%, 587 students, 70% FRL); North Side High School (math 19% / reading 51%, grade F, #266 of 369 statewide, top 73%, 1,474 students, 66% FRL).
- Watch-outs: built in 1930 — expect roof / HVAC / electrical / plumbing capex.
- Market conditions: Rents rising fast (+7.0%/yr); 87 active listings in the ZIP; 15 comparable units currently listed for rent nearby; rentals at typical pace (median 21d on market — plan ~3-4 weeks tenant-placement turnaround); 1,861 units permitted in Allen County in 2024 (576 in 5+ unit buildings).
- Allen County population projected at +10% by 2050 — modest demand growth; plan on rents tracking national, not racing it.
Questions for listing agent
- What do current leases actually rent for vs. the listed asking? Can we see a recent rent roll and the last 12 months of T-12 income?
- Built in 1930 — when were the roof, HVAC, electrical panel, plumbing, and water heater last replaced?
- Is there a deadline driving the sale (1031 exchange, divorce, estate, relocation)? That informs how much negotiation room exists.
- Schools are D-rated, which usually means shorter tenancies and higher turnover. Who's the typical renter profile here, and what's been the actual vacancy rate?
- The area grade is low — what's the realistic commute time and amenity access for the typical tenant pool here? Any planned neighborhood developments (good or bad) we should know about?
- What's the average days-on-market for RENTAL listings here right now (not sales)? A rising rental-DOM trend means longer vacancies and softer asking-rent achievability than the comps imply.
- What's the recent tenant-quality profile in this submarket — average credit score on applications, eviction rate, late-payment / NSF rate, and stable-employment percentage? A property-management company in the area should have these aggregated.
- How much new for-sale + rental construction is in the pipeline within 1–3 miles? Heavy new supply typically softens prices + rents 12–24 months out; constrained supply supports both.
CashFlowRE · CFR-CCPC98FNTF8JDE
· Data 2 days ago
cashflowre.app · 2026-05-29