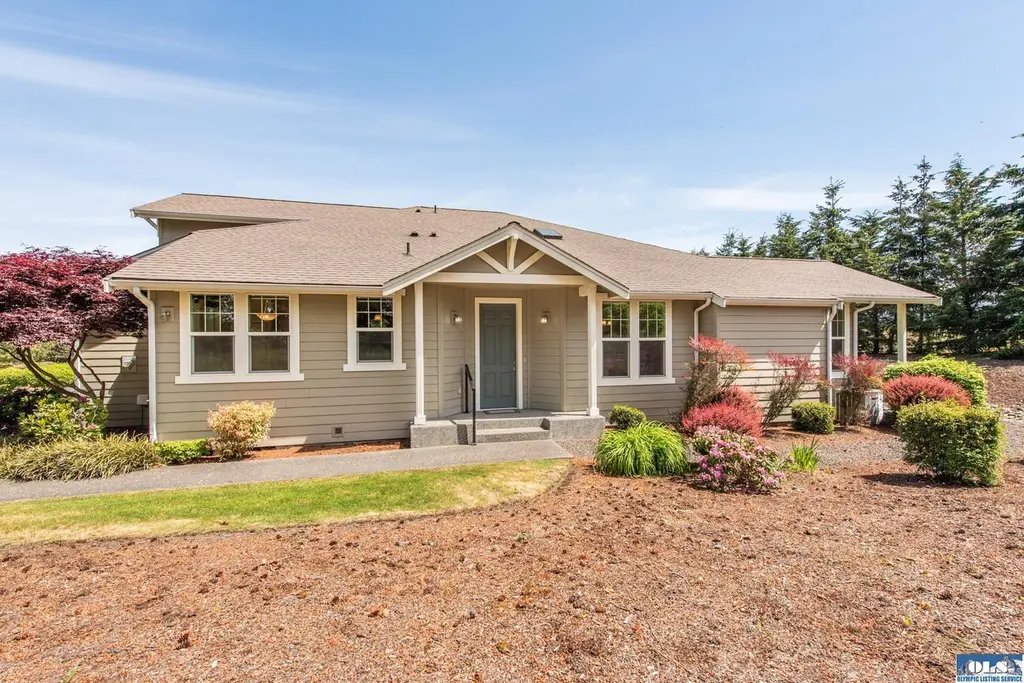
231 Snapdragon Ln
Sequim, WA 98382
$495,000D-
2 bd · 3.0 ba ·
1,844 sqft ·
Built 2014
· MultiFamily
· Active
· 28 DOM
Cashflow @ list (25.0% down · 7.5%)
Estimated rent
$3,935/mo
Mortgage (P&I)
−$2,596
Tax + insurance
−$547
HOA
−$135
Vac / Maint / Mgmt
−$826
Net cashflow
$-170/mo
Annual
$-2,034/yr
Cap rate
5.88%
Cash-on-cash
-1.47%
DSCR
0.93
1% rule
0.79%
Cash to close
$138,600
Investor read
- This is a 2-bed/3.0-bath multifamily listed at $495k.
- At list price, monthly cash flow is $-170 ($-2k/yr) — negative.
- To cash-flow at today's rent, offer at most $465k (6.0% below list).
- To meet the 1% rule (rent ≥ 1% of price), the offer needs to be $394k (20.5% below list).
- It's been on market 28 days — a 2% lower offer ($488k) is reasonable based on typical stale-listing flexibility.
- Recommended offer: $394k (20.5% below list) — sets the bar for 1% rule.
- Local home prices are declining (-3.0%/yr); year-one equity from $3k of loan paydown is wiped out by about $15k of value loss. Plan a longer hold.
- Location reads 70/100 on livability (#245 in WA) — a middle-class / working-renter tenant base. Strengths: health & safety A+, crime B, cost of living B; Watch: employment D, amenities D-, commute F.
- Sequim School District (town): math 55% / reading 66% proficiency, ranked #64 of 291 in WA (top 22%) — acceptable for families but not a draw, mixed tenant base, ~2y average lease.
- Zoned schools: Sequim Senior High (794 students, 50% FRL).
- Market conditions: 605 active listings in the ZIP; 2 comparable units currently listed for rent nearby; 166 units permitted in Clallam County in 2024 (0 in 5+ unit buildings).
- Clallam County population projected at +5% by 2050 — modest demand growth; plan on rents tracking national, not racing it.
- 2 sale attempts with the ask held roughly flat each time — persistent listings suggest the price (not the market) is what's stuck; bring a comps-based counter.
- Cap rate 5.9% vs local median 3.1% in Sequim — top-decile yield for the area; either an underpriced asset or a hidden risk that comps aren't pricing in. Stress-test before assuming the spread holds.
- At $3,935/mo this rent would consume 64% of the median local household income ($74k/yr) (locally 666% of renters already pay >50% of income on rent) — very limited rent-growth headroom before tenants either downsize or default.
Questions for listing agent
- What do current leases actually rent for vs. the listed asking? Can we see a recent rent roll and the last 12 months of T-12 income?
- What does the HOA fee cover, when was the last increase, and are there any pending special assessments or reserve-fund shortfalls?
- Is there a deadline driving the sale (1031 exchange, divorce, estate, relocation)? That informs how much negotiation room exists.
- Schools are B-rated — typically a magnet for longer-tenancy family renters. What's the average tenant stay here, and is there a school-zone premium baked into asking?
- The area grade is low — what's the realistic commute time and amenity access for the typical tenant pool here? Any planned neighborhood developments (good or bad) we should know about?
- What's the average days-on-market for RENTAL listings here right now (not sales)? A rising rental-DOM trend means longer vacancies and softer asking-rent achievability than the comps imply.
- What's the recent tenant-quality profile in this submarket — average credit score on applications, eviction rate, late-payment / NSF rate, and stable-employment percentage? A property-management company in the area should have these aggregated.
- How much new apartment / multifamily construction is in the pipeline within 1–3 miles? Heavy new supply (>2% of stock underway) typically softens rents 12–24 months out; light construction supports rent growth.
CashFlowRE · CFR-CCRZ0N1TSQHCPK
· Data 1 day ago
cashflowre.app · 2026-05-29