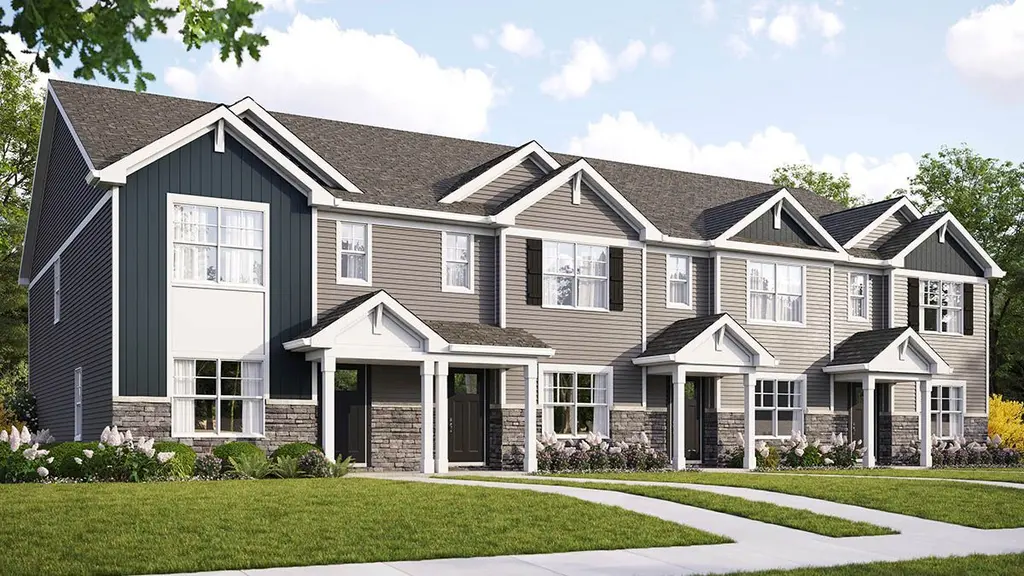
NORFOLK Plan
Yorkville, IL 60560
$317,990D
3 bd · 2.5 ba ·
1,543 sqft ·
Built —
· Townhouse
· Active
· 330 DOM
Cashflow @ list (25.0% down · 7.5%)
Estimated rent
$2,754/mo
Mortgage (P&I)
−$1,722
Tax + insurance
−$547
HOA
−$0
Vac / Maint / Mgmt
−$578
Net cashflow
$-95/mo
Annual
$-1,135/yr
Cap rate
5.95%
Cash-on-cash
-1.23%
DSCR
0.95
1% rule
0.84%
Cash to close
$91,969
Investor read
- This is a 3-bed/2.5-bath townhouse listed at $318k. Condition is rated excellent.
- At list price, monthly cash flow is $-95 ($-1k/yr) — negative.
- To cash-flow at today's rent, offer at most $315k (1.0% below list).
- To meet the 1% rule (rent ≥ 1% of price), the offer needs to be $275k (13.4% below list).
- It's been on market 330 days — a 12% lower offer ($280k) is reasonable based on typical stale-listing flexibility.
- Recommended offer: $275k (13.4% below list) — sets the bar for 1% rule.
- Local home prices are declining (-3.0%/yr); year-one equity from $2k of loan paydown is wiped out by about $10k of value loss. Plan a longer hold.
- Location reads 86/100 on livability (#25 in IL, #458 nationally) — a professional / high-income tenant draw. Strengths: crime A+, amenities A+, employment A+; Watch: commute F.
- Yorkville CUSD 115 (suburban): math 34% / reading 42% proficiency, ranked #131 of 620 in IL (top 21%) — families likely to look elsewhere, expect single-tenant / working-renter base with shorter leases; only 17% free/reduced lunch — higher-income household profile.
- Zoned schools: Grande Reserve Elem Sch (math 39% / reading 46%, grade F, #329 of 2,056 statewide, top 16%, 645 students, 0% FRL); Yorkville Middle School (math 33% / reading 47%, grade F, #140 of 665 statewide, top 22%, 1,105 students, 0% FRL); Yorkville High School (math 32% / reading 39%, grade F, #121 of 693 statewide, top 18%, 2,118 students, 0% FRL) — zoned schools average 0% FRL vs 17% district-wide (17 pts lower); this property's tenant base skews higher-income than the district average.
- Market conditions: 208 active listings in the ZIP; 6 comparable units currently listed for rent nearby; rentals at typical pace (median 22d on market — plan ~3-4 weeks tenant-placement turnaround); high-income renter base; 706 units permitted in Kendall County in 2024 (263 in 5+ unit buildings).
- Kendall County population projected at +20% by 2050 — long-run rental-demand tailwind backs the buy-and-hold thesis.
- Cap rate 5.9% vs local median 4.0% in Yorkville — top-decile yield for the area; either an underpriced asset or a hidden risk that comps aren't pricing in. Stress-test before assuming the spread holds.
Questions for listing agent
- What do current leases actually rent for vs. the listed asking? Can we see a recent rent roll and the last 12 months of T-12 income?
- It's been on market 330 days. Have you received any prior offers? Is the seller open to a 13% concession, seller financing, or rate buy-down credit?
- Why hasn't it sold? Are there any deal-killer items the seller is aware of (foundation, flood, title, zoning, code violations)?
- Is there a deadline driving the sale (1031 exchange, divorce, estate, relocation)? That informs how much negotiation room exists.
- The area grade is low — what's the realistic commute time and amenity access for the typical tenant pool here? Any planned neighborhood developments (good or bad) we should know about?
- What's the average days-on-market for RENTAL listings here right now (not sales)? A rising rental-DOM trend means longer vacancies and softer asking-rent achievability than the comps imply.
- What's the recent tenant-quality profile in this submarket — average credit score on applications, eviction rate, late-payment / NSF rate, and stable-employment percentage? A property-management company in the area should have these aggregated.
- How much new for-sale + rental construction is in the pipeline within 1–3 miles? Heavy new supply typically softens prices + rents 12–24 months out; constrained supply supports both.
CashFlowRE · CFR-CE3B303YVZKFBQ
· Data 1 day ago
cashflowre.app · 2026-05-29