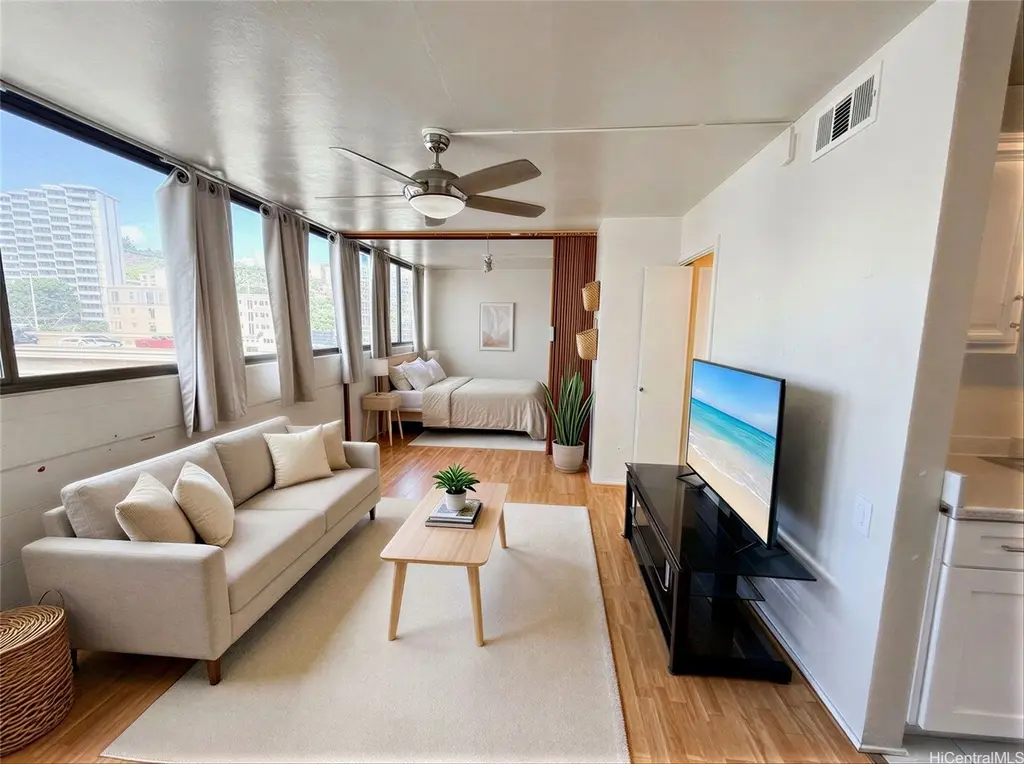
1134 Kinau St #607
Urban Honolulu, HI 96814
$85,000C-
2 bd · 1.0 ba ·
541 sqft ·
Built 1973
· Condo
· Active
· 210 DOM
Cashflow @ list (25.0% down · 7.5%)
Estimated rent
$3,587/mo
Mortgage (P&I)
−$446
Tax + insurance
−$130
HOA
−$1,022
Vac / Maint / Mgmt
−$753
Net cashflow
$1,236/mo
Annual
$14,834/yr
Cap rate
23.74%
Cash-on-cash
62.33%
DSCR
3.77
1% rule
4.22%
Cash to close
$23,800
Investor read
- This is a 2-bed/1.0-bath condo listed at $85k.
- At list price, monthly cash flow is $1k ($15k/yr) — positive.
- The deal already cash-flows at list — no discount required.
- Meets the 1% rule at list price ($4k rent vs $85k).
- It's been on market 210 days — a 12% lower offer ($75k) is reasonable based on typical stale-listing flexibility.
- Recommended offer: $75k (12.0% below list) — sets the bar for market timing.
- In year one you build about $2k of equity ($588 loan paydown + $2k appreciation (2.0% local appreciation)).
- Location reads: area grade C — affects rentability + tenant quality, not the cash-flow math above.
- Hawaii Department Of Education (suburban): math 32% / reading 50% proficiency, ranked #1 of 1 in HI (top 100%) — families likely to look elsewhere, expect single-tenant / working-renter base with shorter leases.
- Watch-outs: HOA is 28% of rent.
- Market conditions: Rents rising (+3.1%/yr); 549 active listings in the ZIP; 40 comparable units currently listed for rent nearby; rentals at typical pace (median 18d on market — plan ~3-4 weeks tenant-placement turnaround); solid renter incomes; 1,638 units permitted in Honolulu County in 2024 (793 in 5+ unit buildings).
- Honolulu County population projected at +17% by 2050 — long-run rental-demand tailwind backs the buy-and-hold thesis.
- 4 sale attempts since 16y ago; this cycle's ask has dropped $5k (6%) from the opening price — seller is motivated, your offer sets the floor, not the list.
- At projected returns (2.0% appreciation + 3.1% rent growth), your $24k cash investment doubles in ~2 years — after that, you're playing with house money.
- Cap rate 23.7% vs local median 1.5% in Urban Honolulu — top-decile yield for the area; either an underpriced asset or a hidden risk that comps aren't pricing in. Stress-test before assuming the spread holds.
- At $3,587/mo this rent would consume 55% of the median local household income ($78k/yr) (locally 1641% of renters already pay >50% of income on rent) — very limited rent-growth headroom before tenants either downsize or default.
Questions for listing agent
- It's been on market 210 days. Have you received any prior offers? Is the seller open to a 12% concession, seller financing, or rate buy-down credit?
- Built in 1973 — when were the roof, HVAC, electrical panel, plumbing, and water heater last replaced?
- What does the HOA fee cover, when was the last increase, and are there any pending special assessments or reserve-fund shortfalls?
- Any open or pending special assessments — roof, HVAC, plumbing, elevator, façade? What's the per-unit balance and payoff schedule, and is the seller paying it off at close or rolling it to the buyer?
- Why hasn't it sold? Are there any deal-killer items the seller is aware of (foundation, flood, title, zoning, code violations)?
- Is there a deadline driving the sale (1031 exchange, divorce, estate, relocation)? That informs how much negotiation room exists.
- What's the average days-on-market for RENTAL listings here right now (not sales)? A rising rental-DOM trend means longer vacancies and softer asking-rent achievability than the comps imply.
- What's the recent tenant-quality profile in this submarket — average credit score on applications, eviction rate, late-payment / NSF rate, and stable-employment percentage? A property-management company in the area should have these aggregated.
CashFlowRE · CFR-CF3PZJ9VXQ23FE
· Data 2 days ago
cashflowre.app · 2026-05-29