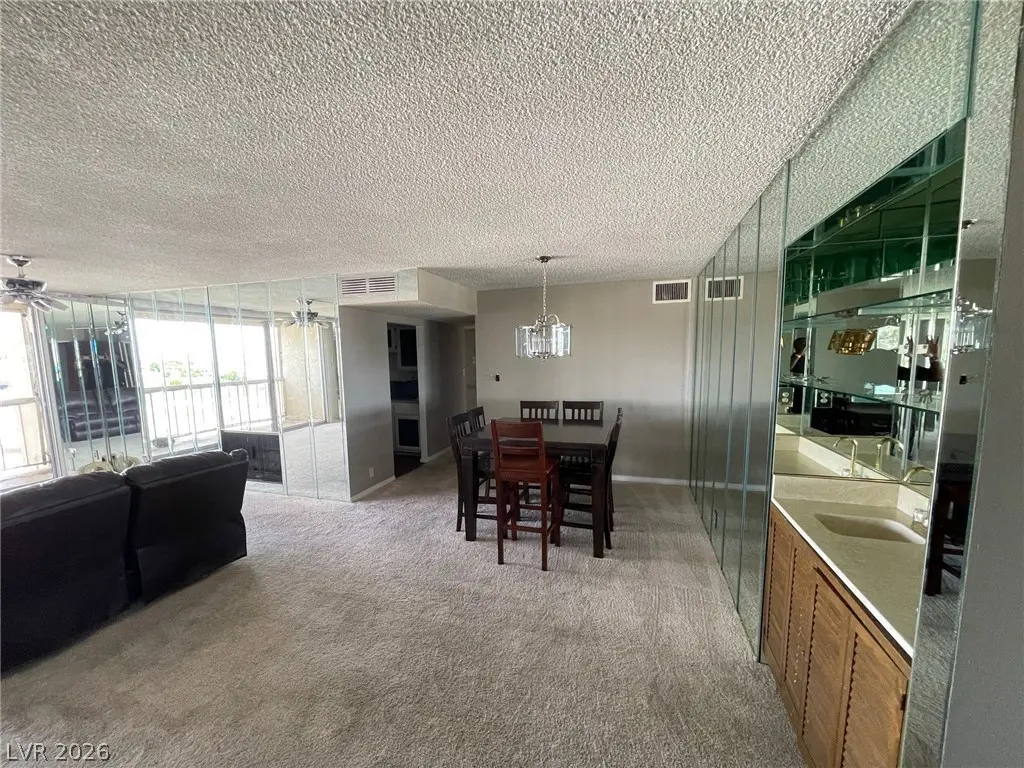
750 S Royal Crest Cir #351
Paradise, NV 89169
$179,900C+
3 bd · 2.0 ba ·
1,549 sqft ·
Built 1976
· Condo
· Active
· 52 DOM
Cashflow @ list (25.0% down · 7.5%)
Estimated rent
$2,666/mo
Mortgage (P&I)
−$943
Tax + insurance
−$138
HOA
−$590
Vac / Maint / Mgmt
−$560
Net cashflow
$434/mo
Annual
$5,213/yr
Cap rate
9.19%
Cash-on-cash
10.35%
DSCR
1.46
1% rule
1.48%
Cash to close
$50,372
Investor read
- This is a 3-bed/2.0-bath condo listed at $180k.
- At list price, monthly cash flow is $434 ($5k/yr) — positive.
- The deal already cash-flows at list — no discount required.
- Meets the 1% rule at list price ($3k rent vs $180k).
- It's been on market 52 days — a 3% lower offer ($175k) is reasonable based on typical stale-listing flexibility.
- Recommended offer: $175k (3.0% below list) — sets the bar for market timing.
- Local home prices are declining (-3.0%/yr); year-one equity from $1k of loan paydown is wiped out by about $5k of value loss. Plan a longer hold.
- Location reads 76/100 on livability (#10 in NV, #3,494 nationally) — a middle-class / working-renter tenant base. Strengths: commute A+, housing A-, cost of living B; Watch: employment D+, schools F, crime D-.
- Clark County School District (urban): math 21% / reading 39% proficiency, ranked #11 of 17 in NV (top 65%) — families likely to look elsewhere, expect single-tenant / working-renter base with shorter leases.
- Watch-outs: HOA is 22% of rent.
- Market conditions: Rents falling (-4.4%/yr); 178 active listings in the ZIP; 40 comparable units currently listed for rent nearby; rentals at typical pace (median 24d on market — plan ~3-4 weeks tenant-placement turnaround); 48% of comp listings sitting > 30 days — soft ceiling on asking rent; lower-income renter base — watch delinquency; 14,754 units permitted in Clark County in 2024 (2,301 in 5+ unit buildings).
- Clark County population projected at +36% by 2050 — long-run rental-demand tailwind backs the buy-and-hold thesis.
- 4 sale attempts since 17y ago; this cycle's ask has dropped $35k (16%) from the opening price — seller is motivated, your offer sets the floor, not the list.
- Climate carrying-cost: extreme-heat days projected 7→16/yr by 2055 (HVAC capex compounding) — expect insurance premiums to compound above CPI over the hold.
- At $2,666/mo this rent would consume 78% of the median local household income ($41k/yr) (locally 2744% of renters already pay >50% of income on rent) — very limited rent-growth headroom before tenants either downsize or default.
Questions for listing agent
- It's been on market 52 days. Have you received any prior offers? Is the seller open to a 3% concession, seller financing, or rate buy-down credit?
- Built in 1976 — when were the roof, HVAC, electrical panel, plumbing, and water heater last replaced?
- What does the HOA fee cover, when was the last increase, and are there any pending special assessments or reserve-fund shortfalls?
- Any open or pending special assessments — roof, HVAC, plumbing, elevator, façade? What's the per-unit balance and payoff schedule, and is the seller paying it off at close or rolling it to the buyer?
- Is there a deadline driving the sale (1031 exchange, divorce, estate, relocation)? That informs how much negotiation room exists.
- Schools are F-rated, which usually means shorter tenancies and higher turnover. Who's the typical renter profile here, and what's been the actual vacancy rate?
- Crime grade is D in this area — have there been break-ins, vandalism, or insurance claims at this property in the last 3 years? What carrier currently insures it and at what premium?
- What's the average days-on-market for RENTAL listings here right now (not sales)? A rising rental-DOM trend means longer vacancies and softer asking-rent achievability than the comps imply.
CashFlowRE · CFR-CFM5QTF6D77776
· Data 1 week ago
cashflowre.app · 2026-05-29