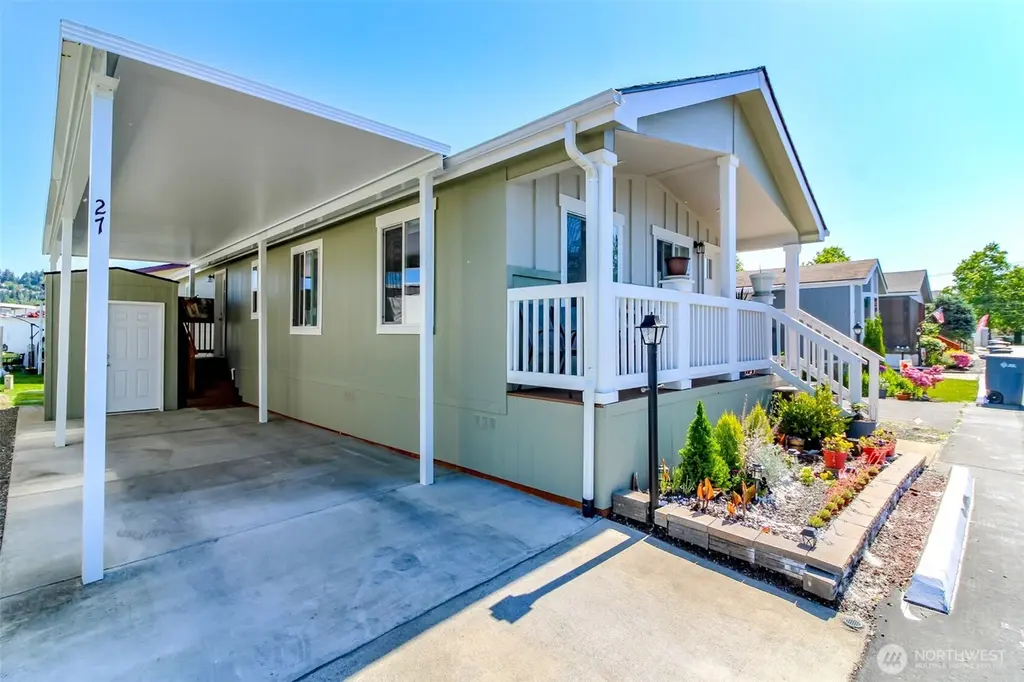
10713 63rd St E #27
North Puyallup, WA 98372
$260,000D
2 bd · 2.0 ba ·
1,040 sqft ·
Built 2022
· Manufactured
· Active
· 38 DOM
Cashflow @ list (25.0% down · 7.5%)
Estimated rent
$1,988/mo
Mortgage (P&I)
−$1,363
Tax + insurance
−$309
HOA
−$0
Vac / Maint / Mgmt
−$418
Net cashflow
$-102/mo
Annual
$-1,226/yr
Cap rate
6.13%
Cash-on-cash
-0.59%
DSCR
0.97
1% rule
0.76%
Cash to close
$72,800
Investor read
- This is a 2-bed/2.0-bath manufactured listed at $260k.
- At list price, monthly cash flow is $-102 ($-1k/yr) — negative.
- To cash-flow at today's rent, offer at most $242k (6.9% below list).
- To meet the 1% rule (rent ≥ 1% of price), the offer needs to be $199k (23.5% below list).
- It's been on market 38 days — a 3% lower offer ($252k) is reasonable based on typical stale-listing flexibility.
- Recommended offer: $199k (23.5% below list) — sets the bar for 1% rule.
- Local home prices are declining (-3.0%/yr); year-one equity from $2k of loan paydown is wiped out by about $8k of value loss. Plan a longer hold.
- Location reads 85/100 on livability (#25 in WA, #468 nationally) — a professional / high-income tenant draw. Strengths: crime A+, amenities A+, housing A+; Watch: employment C-.
- Puyallup School District (suburban): math 53% / reading 66% proficiency, ranked #52 of 291 in WA (top 18%) — acceptable for families but not a draw, mixed tenant base, ~2y average lease.
- Zoned schools: Stewart Elementary (345 students, 68% FRL); Edgemont Jr High (521 students, 38% FRL); Puyallup High School (1,701 students, 38% FRL) — zoned schools average 48% FRL vs 27% district-wide (21 pts higher); higher-poverty schools than district average — tighter screening recommended.
- Watch-outs: flood insurance adds $66/mo.
- Market conditions: Rents rising fast (+4.5%/yr); 169 active listings in the ZIP; 40 comparable units currently listed for rent nearby; rentals at typical pace (median 26d on market — plan ~3-4 weeks tenant-placement turnaround); solid renter incomes; 3,209 units permitted in Pierce County in 2024 (1,269 in 5+ unit buildings).
- Pierce County population projected at +26% by 2050 — long-run rental-demand tailwind backs the buy-and-hold thesis.
- Climate carrying-cost: severe flood risk — expect insurance premiums to compound above CPI over the hold.
Questions for listing agent
- What do current leases actually rent for vs. the listed asking? Can we see a recent rent roll and the last 12 months of T-12 income?
- It's been on market 38 days. Have you received any prior offers? Is the seller open to a 24% concession, seller financing, or rate buy-down credit?
- What's the actual annual flood-insurance premium (NFIP or private), and is the property in a SFHA with mandatory coverage?
- Is there a deadline driving the sale (1031 exchange, divorce, estate, relocation)? That informs how much negotiation room exists.
- The area grade is low — what's the realistic commute time and amenity access for the typical tenant pool here? Any planned neighborhood developments (good or bad) we should know about?
- What's the average days-on-market for RENTAL listings here right now (not sales)? A rising rental-DOM trend means longer vacancies and softer asking-rent achievability than the comps imply.
- What's the recent tenant-quality profile in this submarket — average credit score on applications, eviction rate, late-payment / NSF rate, and stable-employment percentage? A property-management company in the area should have these aggregated.
- How much new for-sale + rental construction is in the pipeline within 1–3 miles? Heavy new supply typically softens prices + rents 12–24 months out; constrained supply supports both.
CashFlowRE · CFR-CGA2NP2BNH15FZ
· Data 1 day ago
cashflowre.app · 2026-05-29