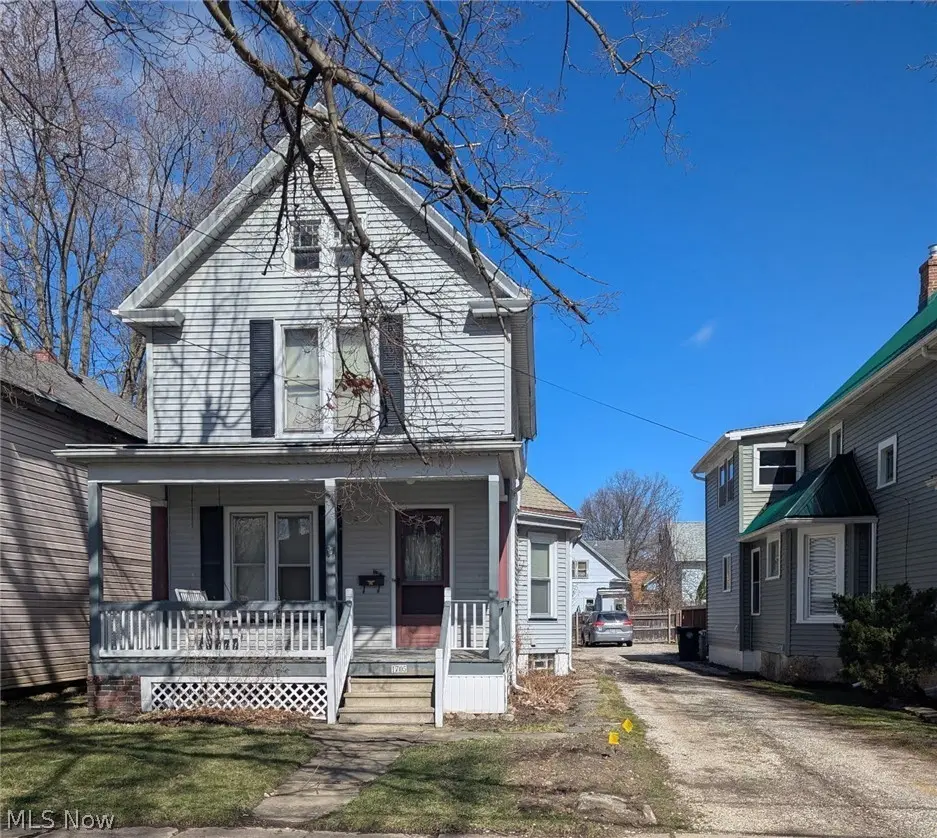
1705 W 5th St
Ashtabula, OH 44004
$59,900D
4 bd · 2.0 ba ·
1,632 sqft ·
Built 1890
· MultiFamily
· Pending
· 6 DOM
Cashflow @ list (25.0% down · 7.5%)
Estimated rent
$3,542/mo
Mortgage (P&I)
−$314
Tax + insurance
−$93
HOA
−$0
Vac / Maint / Mgmt
−$744
Net cashflow
$2,391/mo
Annual
$28,697/yr
Cap rate
54.20%
Cash-on-cash
171.10%
DSCR
8.61
1% rule
5.91%
Cash to close
$16,772
Investor read
- This is a 4-bed/2.0-bath multifamily listed at $60k.
- At list price, monthly cash flow is $2k ($29k/yr) — positive.
- The deal already cash-flows at list — no discount required.
- Meets the 1% rule at list price ($4k rent vs $60k).
- Only 6 days on market — expect competitive offers; lowballing is unlikely to land.
- Local home prices are declining (-3.0%/yr); year-one equity from $414 of loan paydown is wiped out by about $2k of value loss. Plan a longer hold.
- Location reads 71/100 on livability (#420 in OH) — a middle-class / working-renter tenant base. Strengths: cost of living A+, health & safety A+, housing A; Watch: schools C-, amenities F, commute F.
- Ashtabula Area City (town): math 24% / reading 35% proficiency, ranked #588 of 656 in OH (top 90%) — low school quality limits family demand, transient renter base, plan for 1-2y turnover; 63% free/reduced lunch — lower-income household profile, screen leases tightly.
- Watch-outs: built in 1890 — expect roof / HVAC / electrical / plumbing capex.
- Market conditions: 162 active listings in the ZIP; 2 comparable units currently listed for rent nearby; 155 units permitted in Ashtabula County in 2024 (0 in 5+ unit buildings).
- Ashtabula County population projected at -22% by 2050 — secular population decline; favor cash flow + early exit over multi-decade hold.
- 2 sale attempts with the ask held roughly flat each time — persistent listings suggest the price (not the market) is what's stuck; bring a comps-based counter.
- Current owner paid $40k; 50% above their basis — modest negotiation headroom, anchor on the comps not their cost.
- At projected returns (-3.0% appreciation + 3.0% rent growth), your $17k cash investment doubles in ~1 year — after that, you're playing with house money.
- Cap rate 54.2% vs local median 8.2% in Ashtabula — top-decile yield for the area; either an underpriced asset or a hidden risk that comps aren't pricing in. Stress-test before assuming the spread holds.
- At $3,542/mo this rent would consume 86% of the median local household income ($50k/yr) — very limited rent-growth headroom before tenants either downsize or default.
Questions for listing agent
- Built in 1890 — when were the roof, HVAC, electrical panel, plumbing, and water heater last replaced?
- Is there a deadline driving the sale (1031 exchange, divorce, estate, relocation)? That informs how much negotiation room exists.
- The area grade is low — what's the realistic commute time and amenity access for the typical tenant pool here? Any planned neighborhood developments (good or bad) we should know about?
- What's the average days-on-market for RENTAL listings here right now (not sales)? A rising rental-DOM trend means longer vacancies and softer asking-rent achievability than the comps imply.
- What's the recent tenant-quality profile in this submarket — average credit score on applications, eviction rate, late-payment / NSF rate, and stable-employment percentage? A property-management company in the area should have these aggregated.
- How much new apartment / multifamily construction is in the pipeline within 1–3 miles? Heavy new supply (>2% of stock underway) typically softens rents 12–24 months out; light construction supports rent growth.
CashFlowRE · CFR-CGFABPE5JBWBQF
· Data 1 week ago
cashflowre.app · 2026-05-29