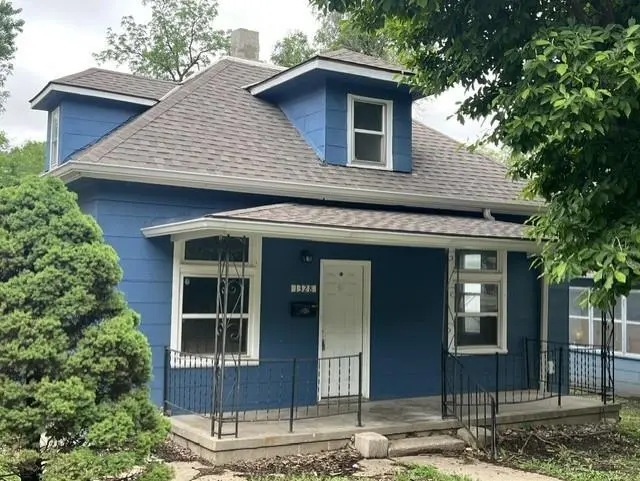
1328 N 12th St
St. Joseph, MO 64501
$117,900C
4 bd · 1.5 ba ·
1,456 sqft ·
Built 1902
· SingleFamily
· Pending
· 7 DOM
Cashflow @ list (25.0% down · 7.5%)
Estimated rent
$1,124/mo
Mortgage (P&I)
−$618
Tax + insurance
−$88
HOA
−$0
Vac / Maint / Mgmt
−$236
Net cashflow
$182/mo
Annual
$2,186/yr
Cap rate
8.15%
Cash-on-cash
6.62%
DSCR
1.29
1% rule
0.95%
Cash to close
$33,012
Investor read
- This is a 4-bed/1.5-bath single-family listed at $118k.
- At list price, monthly cash flow is $182 ($2k/yr) — positive.
- The deal already cash-flows at list — no discount required.
- To meet the 1% rule (rent ≥ 1% of price), the offer needs to be $112k (4.6% below list).
- Only 7 days on market — expect competitive offers; lowballing is unlikely to land.
- Recommended offer: $112k (4.6% below list) — sets the bar for 1% rule.
- Local home prices are declining (-3.0%/yr); year-one equity from $815 of loan paydown is wiped out by about $4k of value loss. Plan a longer hold.
- Location reads: area grade C — affects rentability + tenant quality, not the cash-flow math above.
- St. Joseph (urban): math 28% / reading 38% proficiency, ranked #241 of 324 in MO (top 74%) — families likely to look elsewhere, expect single-tenant / working-renter base with shorter leases.
- Zoned schools: Lindbergh Elem. (math 16% / reading 23%, grade F, #941 of 1,115 statewide, top 86%, 484 students, 99% FRL); Robidoux Middle (math 19% / reading 28%, grade F, #328 of 391 statewide, top 84%, 390 students, 99% FRL); Lafayette High (math 16% / reading 47%, grade F, #371 of 521 statewide, top 71%, 717 students, 100% FRL) — zoned schools average 99% FRL vs 53% district-wide (47 pts higher); higher-poverty schools than district average — tighter screening recommended.
- Watch-outs: built in 1902 — expect roof / HVAC / electrical / plumbing capex.
- Market conditions: 99 active listings in the ZIP; 2 comparable units currently listed for rent nearby; 70 units permitted in Buchanan County in 2024 (0 in 5+ unit buildings).
- Buchanan County population projected to shrink 6% by 2050 — rents likely to lag national; underwrite the cash flow, not the appreciation.
- 2 sale attempts since 2y ago with the ask held roughly flat each time — persistent listings suggest the price (not the market) is what's stuck; bring a comps-based counter.
- Cap rate 8.1% vs local median 4.7% in St. Joseph — top-decile yield for the area; either an underpriced asset or a hidden risk that comps aren't pricing in. Stress-test before assuming the spread holds.
Questions for listing agent
- Built in 1902 — when were the roof, HVAC, electrical panel, plumbing, and water heater last replaced?
- Is there a deadline driving the sale (1031 exchange, divorce, estate, relocation)? That informs how much negotiation room exists.
- What's the average days-on-market for RENTAL listings here right now (not sales)? A rising rental-DOM trend means longer vacancies and softer asking-rent achievability than the comps imply.
- What's the recent tenant-quality profile in this submarket — average credit score on applications, eviction rate, late-payment / NSF rate, and stable-employment percentage? A property-management company in the area should have these aggregated.
- How much new for-sale + rental construction is in the pipeline within 1–3 miles? Heavy new supply typically softens prices + rents 12–24 months out; constrained supply supports both.
CashFlowRE · CFR-CH4TVS214N3J9E
· Data 2 weeks ago
cashflowre.app · 2026-05-29