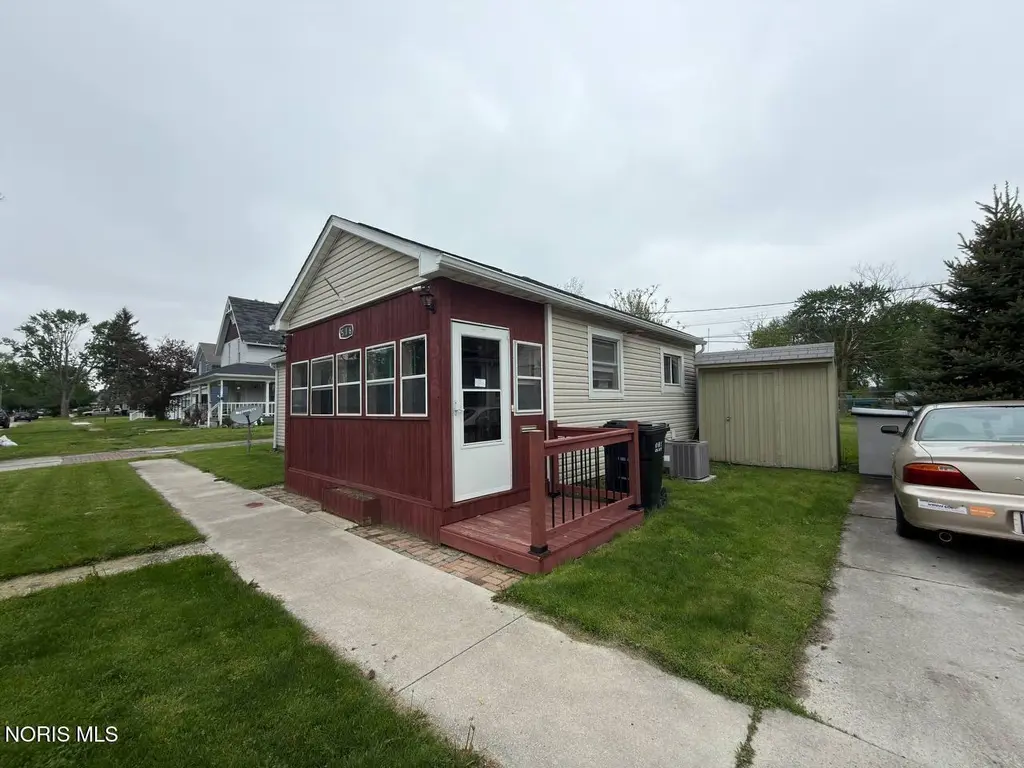
516 Maple St
Fostoria, OH 44830
$92,500C-
2 bd · 1.0 ba ·
700 sqft ·
Built 1940
· SingleFamily
· Active
· 32 DOM
Cashflow @ list (25.0% down · 7.5%)
Estimated rent
$856/mo
Mortgage (P&I)
−$485
Tax + insurance
−$92
HOA
−$0
Vac / Maint / Mgmt
−$180
Net cashflow
$99/mo
Annual
$1,190/yr
Cap rate
7.58%
Cash-on-cash
4.59%
DSCR
1.20
1% rule
0.93%
Cash to close
$25,900
Investor read
- This is a 2-bed/1.0-bath single-family listed at $92k.
- At list price, monthly cash flow is $99 ($1k/yr) — positive.
- The deal already cash-flows at list — no discount required.
- To meet the 1% rule (rent ≥ 1% of price), the offer needs to be $86k (7.5% below list).
- It's been on market 32 days — a 3% lower offer ($90k) is reasonable based on typical stale-listing flexibility.
- Recommended offer: $86k (7.5% below list) — sets the bar for 1% rule.
- Local home prices are declining (-3.0%/yr); year-one equity from $640 of loan paydown is wiped out by about $3k of value loss. Plan a longer hold.
- Location reads 76/100 on livability (#216 in OH, #3,330 nationally) — a middle-class / working-renter tenant base. Strengths: cost of living A+, housing A+, health & safety A+; Watch: schools D+, commute F, employment D-.
- Fostoria City (town): math 30% / reading 39% proficiency, ranked #566 of 656 in OH (top 86%) — families likely to look elsewhere, expect single-tenant / working-renter base with shorter leases; 70% free/reduced lunch — lower-income household profile, screen leases tightly.
- Watch-outs: built in 1940 — expect roof / HVAC / electrical / plumbing capex.
- Market conditions: 44 active listings in the ZIP; 45 units permitted in Seneca County in 2024 (0 in 5+ unit buildings).
- Seneca County population projected at -14% by 2050 — secular population decline; favor cash flow + early exit over multi-decade hold.
- Current owner paid $21k; list at $92k implies a 340% gain — meaningful room to come down on a strong offer.
- Cap rate 7.6% vs local median 4.4% in Fostoria — top-decile yield for the area; either an underpriced asset or a hidden risk that comps aren't pricing in. Stress-test before assuming the spread holds.
- This rent is only 17% of the median local income ($62k/yr) — well below the 30% rent-burden line; pricing power to push rent on renewal without tenant pushback.
Questions for listing agent
- It's been on market 32 days. Have you received any prior offers? Is the seller open to a 7% concession, seller financing, or rate buy-down credit?
- Built in 1940 — when were the roof, HVAC, electrical panel, plumbing, and water heater last replaced?
- Is there a deadline driving the sale (1031 exchange, divorce, estate, relocation)? That informs how much negotiation room exists.
- Schools are D-rated, which usually means shorter tenancies and higher turnover. Who's the typical renter profile here, and what's been the actual vacancy rate?
- What's the average days-on-market for RENTAL listings here right now (not sales)? A rising rental-DOM trend means longer vacancies and softer asking-rent achievability than the comps imply.
- What's the recent tenant-quality profile in this submarket — average credit score on applications, eviction rate, late-payment / NSF rate, and stable-employment percentage? A property-management company in the area should have these aggregated.
- How much new for-sale + rental construction is in the pipeline within 1–3 miles? Heavy new supply typically softens prices + rents 12–24 months out; constrained supply supports both.
CashFlowRE · CFR-CH5ABG515KFMBA
· Data 2 weeks ago
cashflowre.app · 2026-05-29