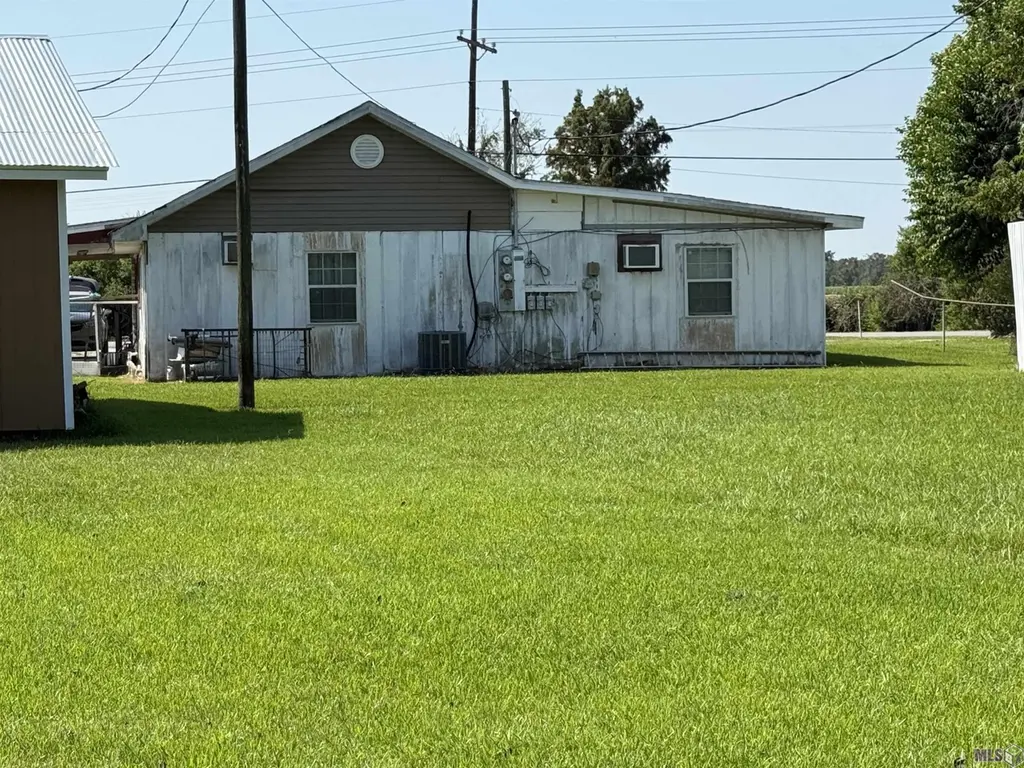
3748 Southdown Mandalay Rd
Houma, LA 70360
$145,000B-
None bd · None ba ·
1,800 sqft ·
Built —
· MultiFamily
· Active
· 38 DOM
Cashflow @ list (25.0% down · 7.5%)
Estimated rent
$2,709/mo
Mortgage (P&I)
−$760
Tax + insurance
−$165
HOA
−$0
Vac / Maint / Mgmt
−$569
Net cashflow
$1,215/mo
Annual
$14,575/yr
Cap rate
16.89%
Cash-on-cash
37.86%
DSCR
2.68
1% rule
1.87%
Cash to close
$40,600
Investor read
- This is a 2 × 3-bed/2-bath units multifamily listed at $145k.
- At list price, monthly cash flow is $1k ($15k/yr) — positive. Per door: $607/mo.
- The deal already cash-flows at list — no discount required.
- Meets the 1% rule at list price ($3k rent vs $145k).
- It's been on market 38 days — a 3% lower offer ($141k) is reasonable based on typical stale-listing flexibility.
- Recommended offer: $141k (3.0% below list) — sets the bar for market timing.
- Local home prices are declining (-3.0%/yr); year-one equity from $1k of loan paydown is wiped out by about $4k of value loss. Plan a longer hold.
- Location reads 64/100 on livability (#165 in LA) — a middle-class / working-renter tenant base. Strengths: cost of living A+, housing A; Watch: employment D, crime D-, amenities F.
- Terrebonne Parish (other): math 32% / reading 46% proficiency, ranked #23 of 98 in LA (top 24%) — families likely to look elsewhere, expect single-tenant / working-renter base with shorter leases; 62% free/reduced lunch — lower-income household profile, screen leases tightly.
- Watch-outs: flood insurance adds $66/mo.
- Market conditions: Rents rising (+2.8%/yr); 355 active listings in the ZIP; solid renter incomes; 300 units permitted in Terrebonne Parish in 2024 (0 in 5+ unit buildings).
- 3 sale attempts with the ask held roughly flat each time — persistent listings suggest the price (not the market) is what's stuck; bring a comps-based counter.
- Current owner paid $20k; list at $145k implies a 644% gain — meaningful room to come down on a strong offer.
- At projected returns (-3.0% appreciation + 2.8% rent growth), your $41k cash investment doubles in ~4 years — after that, you're playing with house money.
- Climate carrying-cost: major flood risk; severe wind risk, 99% chance of damaging wind over 30y; extreme-heat days projected 7→22/yr by 2055 (HVAC capex compounding) — expect insurance premiums to compound above CPI over the hold.
- Cap rate 16.9% vs local median 4.0% in Houma — top-decile yield for the area; either an underpriced asset or a hidden risk that comps aren't pricing in. Stress-test before assuming the spread holds.
- This rent runs 38% of the median local income ($85k/yr) — at the standard rent-burdened threshold; future hikes will face affordability resistance.
Questions for listing agent
- It's been on market 38 days. Have you received any prior offers? Is the seller open to a 3% concession, seller financing, or rate buy-down credit?
- Can we see the unit-by-unit rent roll, current vacancy, and any below-market leases? What's the average tenancy length?
- What capital expenditures (roof, boiler, parking lot, exteriors) have been made in the last 5 years, and what's planned in the next 2?
- What's the actual annual flood-insurance premium (NFIP or private), and is the property in a SFHA with mandatory coverage?
- Is there a deadline driving the sale (1031 exchange, divorce, estate, relocation)? That informs how much negotiation room exists.
- Schools are B-rated — typically a magnet for longer-tenancy family renters. What's the average tenant stay here, and is there a school-zone premium baked into asking?
- Crime grade is D in this area — have there been break-ins, vandalism, or insurance claims at this property in the last 3 years? What carrier currently insures it and at what premium?
- What's the average days-on-market for RENTAL listings here right now (not sales)? A rising rental-DOM trend means longer vacancies and softer asking-rent achievability than the comps imply.
CashFlowRE · CFR-CHYV8G2DJADVP6
· Data 1 day ago
cashflowre.app · 2026-05-29