10 E Broad St
Millville, NJ 08332
$238,900B
None bd · None ba ·
4,650 sqft ·
Built 1950
· MultiFamily
· Active
· 154 DOM
Cashflow @ list (25.0% down · 7.5%)
Estimated rent
$3,473/mo
Mortgage (P&I)
−$1,253
Tax + insurance
−$398
HOA
−$0
Vac / Maint / Mgmt
−$729
Net cashflow
$1,093/mo
Annual
$13,112/yr
Cap rate
11.78%
Cash-on-cash
19.60%
DSCR
1.87
1% rule
1.45%
Cash to close
$66,892
Investor read
- This is a multifamily listed at $239k. Condition is rated fair.
- At list price, monthly cash flow is $1k ($13k/yr) — positive.
- The deal already cash-flows at list — no discount required.
- Meets the 1% rule at list price ($3k rent vs $239k).
- It's been on market 154 days — a 12% lower offer ($210k) is reasonable based on typical stale-listing flexibility.
- Recommended offer: $210k (12.0% below list) — sets the bar for market timing.
- Local home prices are declining (-3.0%/yr); year-one equity from $2k of loan paydown is wiped out by about $7k of value loss. Plan a longer hold.
- Location reads 63/100 on livability (#431 in NJ) — a middle-class / working-renter tenant base. Strengths: housing A+, health & safety B+; Watch: schools F, crime F, amenities F.
- Millville School District (suburban): math 6% / reading 28% proficiency, ranked #447 of 472 in NJ (top 95%) — low school quality limits family demand, transient renter base, plan for 1-2y turnover; 60% free/reduced lunch — lower-income household profile, screen leases tightly.
- Watch-outs: built in 1950 — expect roof / HVAC / electrical / plumbing capex.
- Market conditions: Rents rising (+1.9%/yr); 296 active listings in the ZIP; 216 units permitted in Cumberland County in 2024 (73 in 5+ unit buildings).
- Cumberland County population projected to shrink 7% by 2050 — rents likely to lag national; underwrite the cash flow, not the appreciation.
- 4 sale attempts since 2y ago; this cycle's ask has dropped $21k (8%) from the opening price — seller is motivated, your offer sets the floor, not the list.
- At projected returns (-3.0% appreciation + 1.9% rent growth), your $67k cash investment doubles in ~7 years — after that, you're playing with house money.
- Cap rate 11.8% vs local median 4.2% in Millville — top-decile yield for the area; either an underpriced asset or a hidden risk that comps aren't pricing in. Stress-test before assuming the spread holds.
- At $3,473/mo this rent would consume 62% of the median local household income ($67k/yr) (locally 1761% of renters already pay >50% of income on rent) — very limited rent-growth headroom before tenants either downsize or default.
Questions for listing agent
- It's been on market 154 days. Have you received any prior offers? Is the seller open to a 12% concession, seller financing, or rate buy-down credit?
- Have any recent inspections been done? Can we get a copy of the seller's disclosures and any deferred-maintenance estimates?
- Built in 1950 — when were the roof, HVAC, electrical panel, plumbing, and water heater last replaced?
- Why hasn't it sold? Are there any deal-killer items the seller is aware of (foundation, flood, title, zoning, code violations)?
- Is there a deadline driving the sale (1031 exchange, divorce, estate, relocation)? That informs how much negotiation room exists.
- Schools are F-rated, which usually means shorter tenancies and higher turnover. Who's the typical renter profile here, and what's been the actual vacancy rate?
- Crime grade is F in this area — have there been break-ins, vandalism, or insurance claims at this property in the last 3 years? What carrier currently insures it and at what premium?
- What's the average days-on-market for RENTAL listings here right now (not sales)? A rising rental-DOM trend means longer vacancies and softer asking-rent achievability than the comps imply.
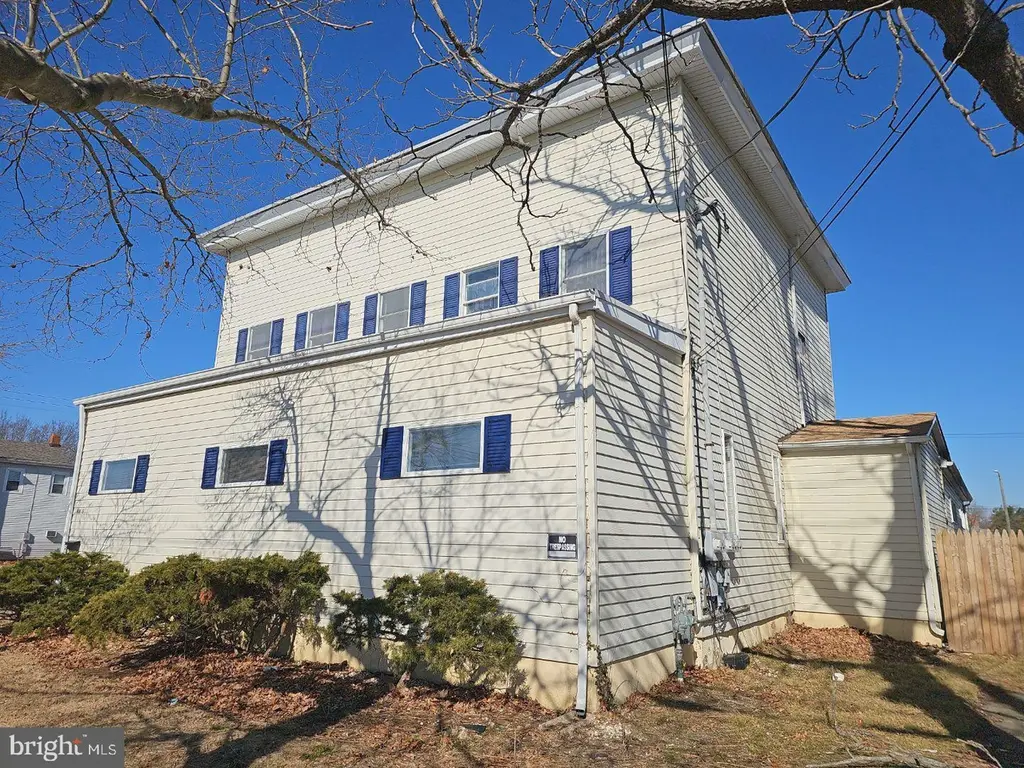
Repairs flagged (vision-AI assessment)
- Moderate: siding — Weathered and discolored
- Moderate: exterior paint — Visible wear
CashFlowRE · CFR-CMFZ4X8S4ME7Q0
· Data 1 day ago
cashflowre.app · 2026-05-29