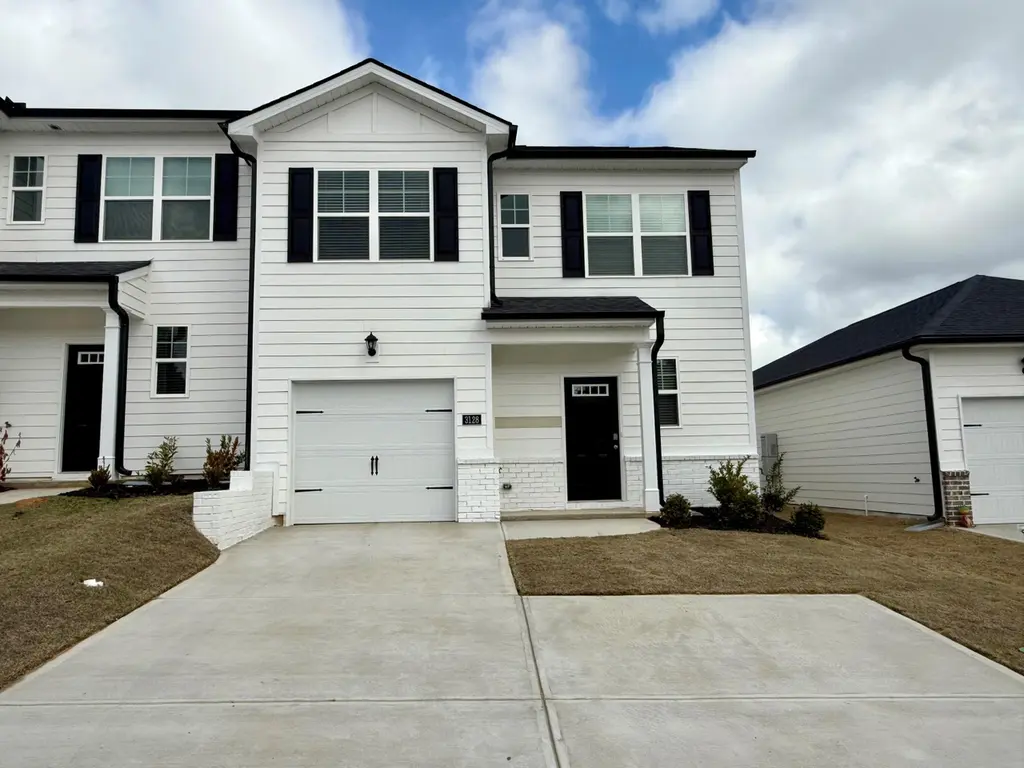
3099 Nolana Lp Loop
Graniteville, SC 29829
$219,000C+
3 bd · 2.5 ba ·
1,605 sqft ·
Built 2025
· Townhouse
· Active
· 5 DOM
Cashflow @ list (25.0% down · 7.5%)
Estimated rent
$2,220/mo
Mortgage (P&I)
−$1,148
Tax + insurance
−$133
HOA
−$190
Vac / Maint / Mgmt
−$466
Net cashflow
$282/mo
Annual
$3,388/yr
Cap rate
7.84%
Cash-on-cash
5.52%
DSCR
1.25
1% rule
1.01%
Cash to close
$61,320
Investor read
- This is a 3-bed/2.5-bath townhouse listed at $219k. Condition is rated excellent.
- At list price, monthly cash flow is $282 ($3k/yr) — positive.
- The deal already cash-flows at list — no discount required.
- Meets the 1% rule at list price ($2k rent vs $219k).
- Only 5 days on market — expect competitive offers; lowballing is unlikely to land.
- In year one you build about $20k of equity ($2k loan paydown + $18k appreciation (8.4% local appreciation)).
- Location reads 59/100 on livability (#240 in SC) — a working-class tenant base; expect higher turnover. Strengths: cost of living A+, crime B+; Watch: schools F, amenities F, commute F.
- Aiken 01 (suburban): math 31% / reading 44% proficiency, ranked #36 of 80 in SC (top 45%) — families likely to look elsewhere, expect single-tenant / working-renter base with shorter leases.
- Market conditions: 299 active listings in the ZIP; 4 comparable units currently listed for rent nearby; rentals at typical pace (median 22d on market — plan ~3-4 weeks tenant-placement turnaround); solid renter incomes; 2,500 units permitted in Aiken County in 2024 (1,023 in 5+ unit buildings).
- Aiken County population projected at +9% by 2050 — modest demand growth; plan on rents tracking national, not racing it.
- 3 sale attempts with the ask held roughly flat each time — persistent listings suggest the price (not the market) is what's stuck; bring a comps-based counter.
- At projected returns (8.4% appreciation + 3.0% rent growth), your $61k cash investment doubles in ~3 years — after that, you're playing with house money.
- By year 2, paydown + projected appreciation supports a ~$32k cash-out refi (75% LTV) — recoverable capital for the next deal without selling this one.
- Cap rate 7.8% vs local median 5.7% in Graniteville — top-decile yield for the area; either an underpriced asset or a hidden risk that comps aren't pricing in. Stress-test before assuming the spread holds.
- This rent runs 32% of the median local income ($84k/yr) — at the standard rent-burdened threshold; future hikes will face affordability resistance.
Questions for listing agent
- What does the HOA fee cover, when was the last increase, and are there any pending special assessments or reserve-fund shortfalls?
- Is there a deadline driving the sale (1031 exchange, divorce, estate, relocation)? That informs how much negotiation room exists.
- Schools are F-rated, which usually means shorter tenancies and higher turnover. Who's the typical renter profile here, and what's been the actual vacancy rate?
- What's the average days-on-market for RENTAL listings here right now (not sales)? A rising rental-DOM trend means longer vacancies and softer asking-rent achievability than the comps imply.
- What's the recent tenant-quality profile in this submarket — average credit score on applications, eviction rate, late-payment / NSF rate, and stable-employment percentage? A property-management company in the area should have these aggregated.
- How much new for-sale + rental construction is in the pipeline within 1–3 miles? Heavy new supply typically softens prices + rents 12–24 months out; constrained supply supports both.
CashFlowRE · CFR-CNEBFQBT9G2XR7
· Data 1 h ago
cashflowre.app · 2026-05-29