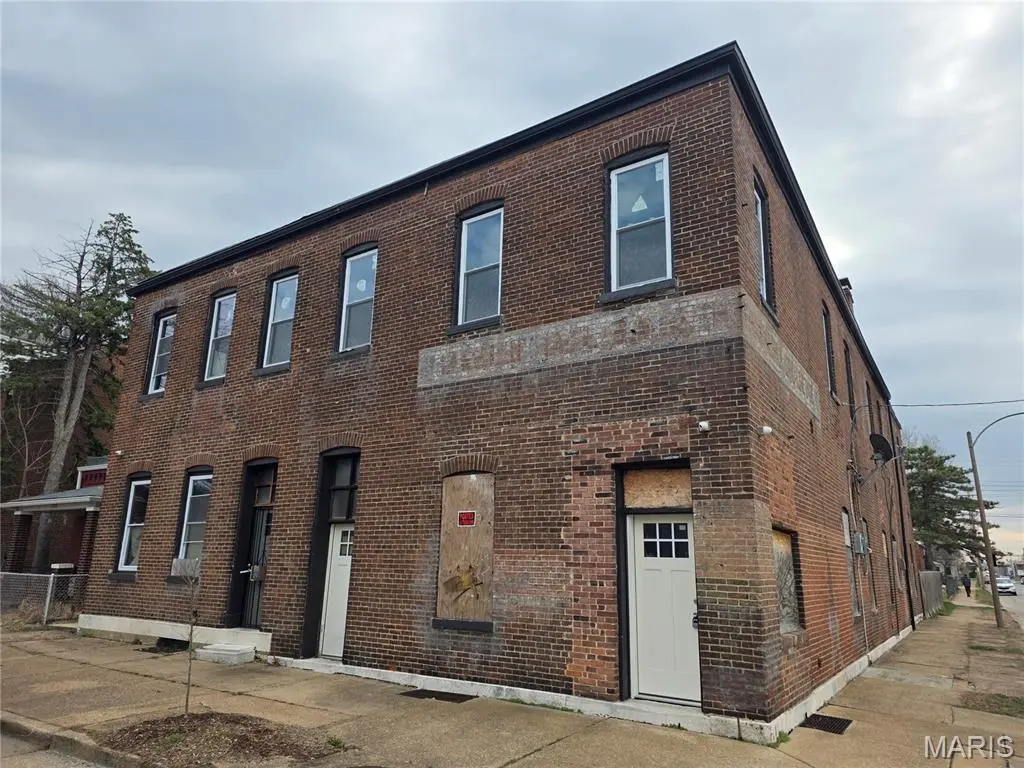
7726 Minnesota Ave
St. Louis, MO 63111
$219,900B
24 bd · 4.0 ba ·
6,144 sqft ·
Built 1890
· MultiFamily
· Active
· 84 DOM
Cashflow @ list (25.0% down · 7.5%)
Estimated rent
$5,041/mo
Mortgage (P&I)
−$1,153
Tax + insurance
−$366
HOA
−$0
Vac / Maint / Mgmt
−$1,059
Net cashflow
$2,463/mo
Annual
$29,553/yr
Cap rate
19.73%
Cash-on-cash
48.00%
DSCR
3.14
1% rule
2.29%
Cash to close
$61,572
Investor read
- This is a 2×1bd/1.0ba + 2×2bd/1.0ba units multifamily listed at $220k.
- At list price, monthly cash flow is $2k ($30k/yr) — positive. Per door: $616/mo.
- The deal already cash-flows at list — no discount required.
- Meets the 1% rule at list price ($5k rent vs $220k).
- It's been on market 84 days — a 6% lower offer ($207k) is reasonable based on typical stale-listing flexibility.
- Recommended offer: $207k (6.0% below list) — sets the bar for market timing.
- Local home prices are declining (-3.0%/yr); year-one equity from $2k of loan paydown is wiped out by about $7k of value loss. Plan a longer hold.
- Location reads: area grade B — affects rentability + tenant quality, not the cash-flow math above.
- St. Louis City (urban): math 10% / reading 18% proficiency, ranked #312 of 324 in MO (top 96%) — low school quality limits family demand, transient renter base, plan for 1-2y turnover; 80% free/reduced lunch — lower-income household profile, screen leases tightly.
- Watch-outs: built in 1890 — expect roof / HVAC / electrical / plumbing capex.
- Market conditions: Rents rising (+3.3%/yr); 125 active listings in the ZIP; 294 units permitted in St. Louis city in 2024 (227 in 5+ unit buildings).
- St. Louis County population projected to shrink 6% by 2050 — rents likely to lag national; underwrite the cash flow, not the appreciation.
- 9 sale attempts since 12y ago; this cycle's ask has dropped $20k (8%) from the opening price — seller is motivated, your offer sets the floor, not the list.
- Current owner paid $50k; list at $220k implies a 341% gain — meaningful room to come down on a strong offer.
- At projected returns (-3.0% appreciation + 3.3% rent growth), your $62k cash investment doubles in ~3 years — after that, you're playing with house money.
- Climate carrying-cost: moderate flood risk; extreme-heat days projected 7→21/yr by 2055 (HVAC capex compounding) — expect insurance premiums to compound above CPI over the hold.
- Cap rate 19.7% vs local median 5.0% in St. Louis — top-decile yield for the area; either an underpriced asset or a hidden risk that comps aren't pricing in. Stress-test before assuming the spread holds.
- At $5,041/mo this rent would consume 129% of the median local household income ($47k/yr) (locally 1364% of renters already pay >50% of income on rent) — very limited rent-growth headroom before tenants either downsize or default.
Questions for listing agent
- It's been on market 84 days. Have you received any prior offers? Is the seller open to a 6% concession, seller financing, or rate buy-down credit?
- Can we see the unit-by-unit rent roll, current vacancy, and any below-market leases? What's the average tenancy length?
- What capital expenditures (roof, boiler, parking lot, exteriors) have been made in the last 5 years, and what's planned in the next 2?
- Built in 1890 — when were the roof, HVAC, electrical panel, plumbing, and water heater last replaced?
- Why hasn't it sold? Are there any deal-killer items the seller is aware of (foundation, flood, title, zoning, code violations)?
- Is there a deadline driving the sale (1031 exchange, divorce, estate, relocation)? That informs how much negotiation room exists.
- What's the average days-on-market for RENTAL listings here right now (not sales)? A rising rental-DOM trend means longer vacancies and softer asking-rent achievability than the comps imply.
- What's the recent tenant-quality profile in this submarket — average credit score on applications, eviction rate, late-payment / NSF rate, and stable-employment percentage? A property-management company in the area should have these aggregated.
CashFlowRE · CFR-CPAPWKB19RWGEW
· Data 2 days ago
cashflowre.app · 2026-05-29