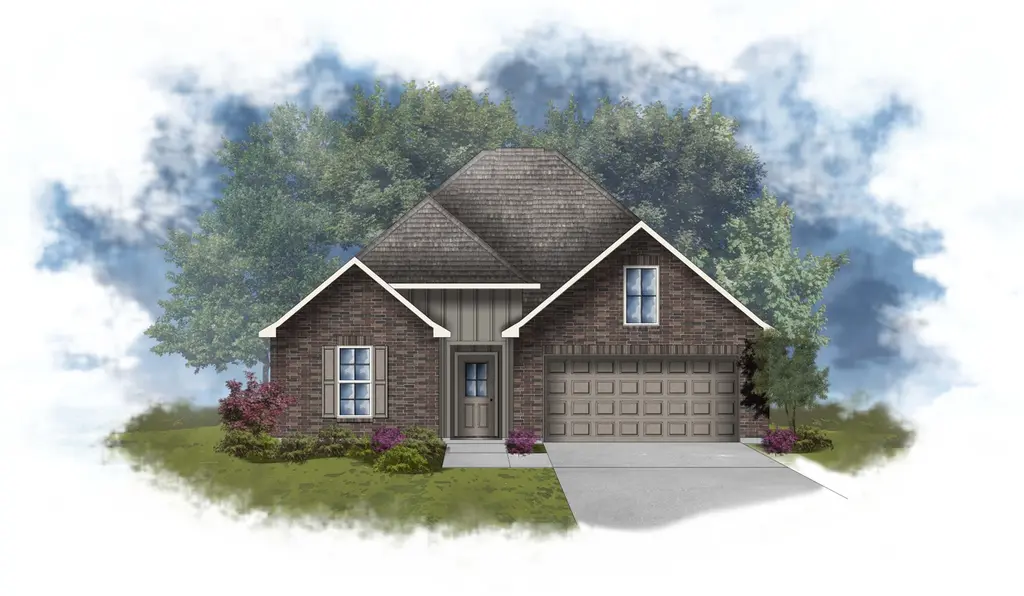
Lasalle V H Plan
Lyman, MS 39503
$259,990D-
3 bd · 2.0 ba ·
1,710 sqft ·
Built —
· SingleFamily
· Active
· 393 DOM
Cashflow @ list (25.0% down · 7.5%)
Estimated rent
$2,177/mo
Mortgage (P&I)
−$1,453
Tax + insurance
−$462
HOA
−$0
Vac / Maint / Mgmt
−$457
Net cashflow
$-194/mo
Annual
$-2,330/yr
Cap rate
5.45%
Cash-on-cash
-3.00%
DSCR
0.87
1% rule
0.79%
Cash to close
$77,558
Investor read
- This is a 3-bed/2.0-bath single-family listed at $260k. Condition is rated fair.
- At list price, monthly cash flow is $-194 ($-2k/yr) — negative.
- To cash-flow at today's rent, offer at most $249k (4.3% below list).
- To meet the 1% rule (rent ≥ 1% of price), the offer needs to be $218k (16.3% below list).
- It's been on market 393 days — a 12% lower offer ($229k) is reasonable based on typical stale-listing flexibility.
- Recommended offer: $218k (16.3% below list) — sets the bar for 1% rule.
- Local home prices are declining (-3.0%/yr); year-one equity from $2k of loan paydown is wiped out by about $8k of value loss. Plan a longer hold.
- Location reads 69/100 on livability (#47 in MS) — a middle-class / working-renter tenant base. Strengths: crime A+, employment A+, cost of living A+; Watch: schools F, amenities F, commute F.
- Harrison County School District (rural): math 52% / reading 46% proficiency, ranked #14 of 130 in MS (top 11%) — families likely to look elsewhere, expect single-tenant / working-renter base with shorter leases; 62% free/reduced lunch — lower-income household profile, screen leases tightly.
- Market conditions: Rents rising fast (+7.0%/yr); 770 active listings in the ZIP; 4 comparable units currently listed for rent nearby; rentals at typical pace (median 23d on market — plan ~3-4 weeks tenant-placement turnaround); 2,194 units permitted in Harrison County in 2024 (0 in 5+ unit buildings).
- Harrison County population projected at +27% by 2050 — long-run rental-demand tailwind backs the buy-and-hold thesis.
- Cap rate 5.5% vs local median 4.4% in Lyman — meaningfully above typical; check what's discounted (condition, days-on-market, listing class) to confirm the premium yield is real.
- This rent runs 42% of the median local income ($63k/yr) — at the standard rent-burdened threshold; future hikes will face affordability resistance.
Questions for listing agent
- What do current leases actually rent for vs. the listed asking? Can we see a recent rent roll and the last 12 months of T-12 income?
- It's been on market 393 days. Have you received any prior offers? Is the seller open to a 16% concession, seller financing, or rate buy-down credit?
- Have any recent inspections been done? Can we get a copy of the seller's disclosures and any deferred-maintenance estimates?
- Why hasn't it sold? Are there any deal-killer items the seller is aware of (foundation, flood, title, zoning, code violations)?
- Is there a deadline driving the sale (1031 exchange, divorce, estate, relocation)? That informs how much negotiation room exists.
- Schools are F-rated, which usually means shorter tenancies and higher turnover. Who's the typical renter profile here, and what's been the actual vacancy rate?
- The area grade is low — what's the realistic commute time and amenity access for the typical tenant pool here? Any planned neighborhood developments (good or bad) we should know about?
- What's the average days-on-market for RENTAL listings here right now (not sales)? A rising rental-DOM trend means longer vacancies and softer asking-rent achievability than the comps imply.
Repairs flagged (vision-AI assessment)
- Minor: Landscaping — Some overgrown bushes
- Minor: Fencing — White picket fence appears slightly worn
CashFlowRE · CFR-CPMY9CDFYYHKR4
· Data 23 h ago
cashflowre.app · 2026-05-29