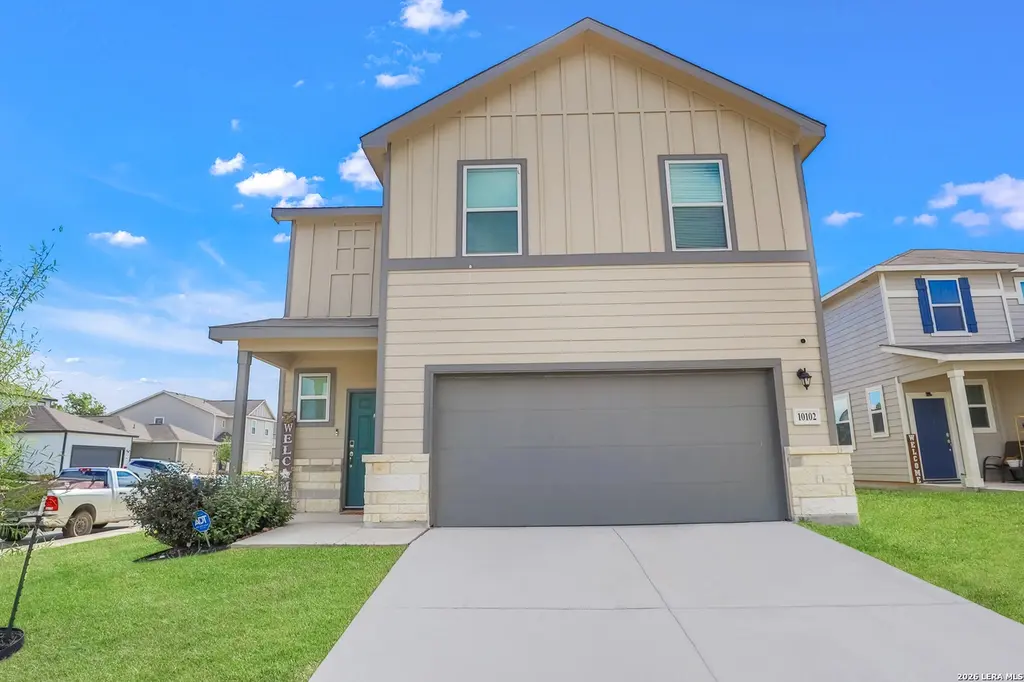
10102 Tercero
San Antonio, TX 78224
$209,000C-
4 bd · 2.5 ba ·
2,097 sqft ·
Built 2022
· SingleFamily
· Pending
· 29 DOM
Cashflow @ list (25.0% down · 7.5%)
Estimated rent
$1,964/mo
Mortgage (P&I)
−$1,096
Tax + insurance
−$673
HOA
−$27
Vac / Maint / Mgmt
−$412
Net cashflow
$-244/mo
Annual
$-2,932/yr
Cap rate
4.89%
Cash-on-cash
-5.01%
DSCR
0.78
1% rule
0.94%
Cash to close
$58,520
Investor read
- This is a 4-bed/2.5-bath single-family listed at $209k. Condition is rated good.
- At list price, monthly cash flow is $-244 ($-3k/yr) — negative.
- To cash-flow at today's rent, offer at most $166k (20.7% below list).
- To meet the 1% rule (rent ≥ 1% of price), the offer needs to be $196k (6.0% below list).
- It's been on market 29 days — a 2% lower offer ($206k) is reasonable based on typical stale-listing flexibility.
- Recommended offer: $166k (20.7% below list) — sets the bar for cash-flow.
- In year one you build about $22k of equity ($1k loan paydown + $21k appreciation (10.0% local appreciation)).
- Location reads 80/100 on livability (#31 in TX, #1,616 nationally) — a professional / high-income tenant draw. Strengths: amenities A+, commute A+, cost of living A+; Watch: crime F.
- Southwest ISD (rural): math 21% / reading 31% proficiency, ranked #701 of 826 in TX (top 85%) — low school quality limits family demand, transient renter base, plan for 1-2y turnover; 75% free/reduced lunch — lower-income household profile, screen leases tightly.
- Zoned schools: Spicewood Park El (math 16% / reading 23%, grade F, #3,583 of 4,322 statewide, top 86%, 593 students, 93% FRL); Southwest H S (math 17% / reading 39%, grade F, #1,170 of 1,632 statewide, top 72%, 2,152 students, 72% FRL).
- Watch-outs: property tax is 3.4% of price.
- Market conditions: Rents flat; 274 active listings in the ZIP; 37 comparable units currently listed for rent nearby; rentals at typical pace (median 25d on market — plan ~3-4 weeks tenant-placement turnaround); 46% of comp listings sitting > 30 days — soft ceiling on asking rent; 8,308 units permitted in Bexar County in 2024 (2,506 in 5+ unit buildings).
- Bexar County population projected at +50% by 2050 — long-run rental-demand tailwind backs the buy-and-hold thesis.
- 2 sale attempts since 3y ago; this cycle's ask has dropped $30k (13%) from the opening price — seller is motivated, your offer sets the floor, not the list.
- By year 2, paydown + projected appreciation supports a ~$36k cash-out refi (75% LTV) — recoverable capital for the next deal without selling this one.
- Climate carrying-cost: severe wind risk, 80% chance of damaging wind over 30y; extreme-heat days projected 5→16/yr by 2055 (HVAC capex compounding) — expect insurance premiums to compound above CPI over the hold.
- Cap rate 4.9% vs local median 3.8% in San Antonio — meaningfully above typical; check what's discounted (condition, days-on-market, listing class) to confirm the premium yield is real.
- This rent runs 39% of the median local income ($60k/yr) — at the standard rent-burdened threshold; future hikes will face affordability resistance.
Questions for listing agent
- What do current leases actually rent for vs. the listed asking? Can we see a recent rent roll and the last 12 months of T-12 income?
- Property tax is high relative to price — has the assessment been appealed recently, and will the sale trigger a re-assessment?
- What does the HOA fee cover, when was the last increase, and are there any pending special assessments or reserve-fund shortfalls?
- Is there a deadline driving the sale (1031 exchange, divorce, estate, relocation)? That informs how much negotiation room exists.
- Crime grade is F in this area — have there been break-ins, vandalism, or insurance claims at this property in the last 3 years? What carrier currently insures it and at what premium?
- What's the average days-on-market for RENTAL listings here right now (not sales)? A rising rental-DOM trend means longer vacancies and softer asking-rent achievability than the comps imply.
- What's the recent tenant-quality profile in this submarket — average credit score on applications, eviction rate, late-payment / NSF rate, and stable-employment percentage? A property-management company in the area should have these aggregated.
- How much new for-sale + rental construction is in the pipeline within 1–3 miles? Heavy new supply typically softens prices + rents 12–24 months out; constrained supply supports both.
CashFlowRE · CFR-CQ1EGFBX3P07CV
· Data 1 week ago
cashflowre.app · 2026-05-29