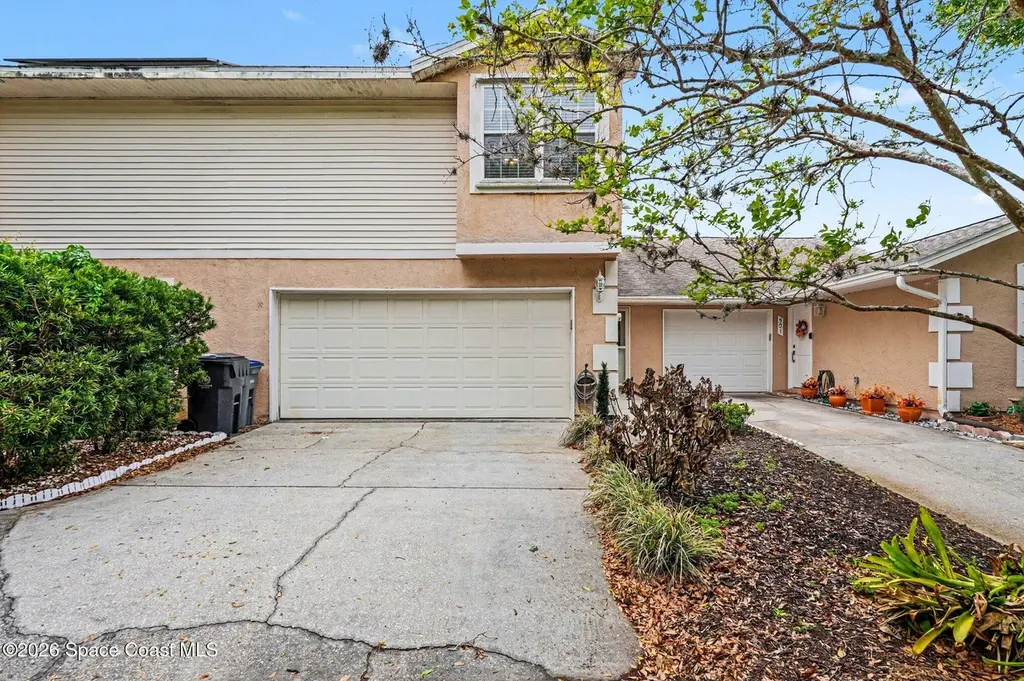
499 Arbor Ridge Ln
Titusville, FL 32780
$249,900D
3 bd · 2.0 ba ·
1,758 sqft ·
Built 1996
· Townhouse
· Active
· 94 DOM
Cashflow @ list (25.0% down · 7.5%)
Estimated rent
$2,011/mo
Mortgage (P&I)
−$1,311
Tax + insurance
−$177
HOA
−$110
Vac / Maint / Mgmt
−$422
Net cashflow
$-9/mo
Annual
$-104/yr
Cap rate
6.25%
Cash-on-cash
-0.15%
DSCR
0.99
1% rule
0.80%
Cash to close
$69,972
Investor read
- This is a 3-bed/2.0-bath townhouse listed at $250k.
- At list price, monthly cash flow is $-9 ($-104/yr) — negative.
- To cash-flow at today's rent, offer at most $248k (0.6% below list).
- To meet the 1% rule (rent ≥ 1% of price), the offer needs to be $201k (19.5% below list).
- It's been on market 94 days — a 9% lower offer ($227k) is reasonable based on typical stale-listing flexibility.
- Recommended offer: $201k (19.5% below list) — sets the bar for 1% rule.
- Local home prices are declining (-3.0%/yr); year-one equity from $2k of loan paydown is wiped out by about $7k of value loss. Plan a longer hold.
- Location reads 84/100 on livability (#42 in FL, #668 nationally) — a professional / high-income tenant draw. Strengths: commute A+, cost of living A+, housing A+; Watch: crime D, employment D.
- Brevard (suburban): math 53% / reading 57% proficiency, ranked #19 of 73 in FL (top 26%) — acceptable for families but not a draw, mixed tenant base, ~2y average lease.
- Zoned schools: Imperial Estates Elementary School (math 46% / reading 50%, grade D, #1,171 of 2,144 statewide, top 55%, 658 students, 58% FRL); Andrew Jackson Middle School (math 52% / reading 47%, grade C, #259 of 571 statewide, top 46%, 551 students, 58% FRL); Titusville High School (math 33% / reading 52%, grade F, #264 of 667 statewide, top 41%, 1,314 students, 55% FRL).
- Market conditions: Rents rising (+1.3%/yr); 465 active listings in the ZIP; 10 comparable units currently listed for rent nearby; rentals at typical pace (median 26d on market — plan ~3-4 weeks tenant-placement turnaround); 4,602 units permitted in Brevard County in 2024 (702 in 5+ unit buildings).
- Brevard County population projected at +15% by 2050 — modest demand growth; plan on rents tracking national, not racing it.
- 3 sale attempts since 21y ago; this cycle's ask has dropped $35k (12%) from the opening price — seller is motivated, your offer sets the floor, not the list.
- Current owner paid $120k; list at $250k implies a 108% gain — meaningful room to come down on a strong offer.
- Climate carrying-cost: severe wind risk, 99% chance of damaging wind over 30y — expect insurance premiums to compound above CPI over the hold.
- This rent runs 36% of the median local income ($68k/yr) — at the standard rent-burdened threshold; future hikes will face affordability resistance.
Questions for listing agent
- What do current leases actually rent for vs. the listed asking? Can we see a recent rent roll and the last 12 months of T-12 income?
- It's been on market 94 days. Have you received any prior offers? Is the seller open to a 20% concession, seller financing, or rate buy-down credit?
- What does the HOA fee cover, when was the last increase, and are there any pending special assessments or reserve-fund shortfalls?
- Why hasn't it sold? Are there any deal-killer items the seller is aware of (foundation, flood, title, zoning, code violations)?
- Is there a deadline driving the sale (1031 exchange, divorce, estate, relocation)? That informs how much negotiation room exists.
- Crime grade is D in this area — have there been break-ins, vandalism, or insurance claims at this property in the last 3 years? What carrier currently insures it and at what premium?
- The area grade is low — what's the realistic commute time and amenity access for the typical tenant pool here? Any planned neighborhood developments (good or bad) we should know about?
- What's the average days-on-market for RENTAL listings here right now (not sales)? A rising rental-DOM trend means longer vacancies and softer asking-rent achievability than the comps imply.
CashFlowRE · CFR-CS20QZ25S01E6P
· Data 10 h ago
cashflowre.app · 2026-05-29