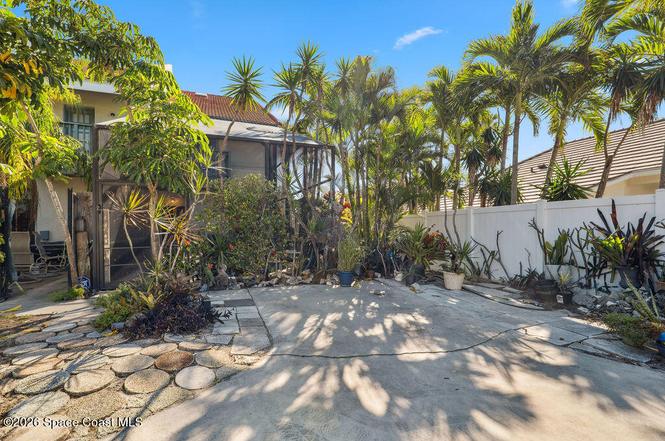
3048 S Highway A1a Unit 4d
Palm Bay, FL 32951
$439,000D
3 bd · 2.5 ba ·
1,542 sqft ·
Built 1984
· Condo
· Active
· 102 DOM
Cashflow @ list (25.0% down · 7.5%)
Estimated rent
$4,449/mo
Mortgage (P&I)
−$2,302
Tax + insurance
−$565
HOA
−$833
Vac / Maint / Mgmt
−$934
Net cashflow
$-186/mo
Annual
$-2,228/yr
Cap rate
5.79%
Cash-on-cash
-1.81%
DSCR
0.92
1% rule
1.01%
Cash to close
$122,920
Investor read
- This is a 3-bed/2.5-bath condo listed at $439k.
- At list price, monthly cash flow is $-186 ($-2k/yr) — negative.
- To cash-flow at today's rent, offer at most $406k (7.5% below list).
- Meets the 1% rule at list price ($4k rent vs $439k).
- It's been on market 102 days — a 9% lower offer ($399k) is reasonable based on typical stale-listing flexibility.
- Recommended offer: $399k (9.0% below list) — sets the bar for market timing.
- Local home prices are declining (-3.0%/yr); year-one equity from $3k of loan paydown is wiped out by about $13k of value loss. Plan a longer hold.
- Location reads 72/100 on livability (#366 in FL) — a middle-class / working-renter tenant base. Strengths: cost of living A+, housing A+; Watch: employment D+, amenities F, health & safety D-.
- Brevard (suburban): math 53% / reading 57% proficiency, ranked #19 of 73 in FL (top 26%) — acceptable for families but not a draw, mixed tenant base, ~2y average lease.
- Zoned schools: Gemini Elementary School (math 80% / reading 79%, grade A, #116 of 2,144 statewide, top 6%, 468 students, 20% FRL); Herbert C. Hoover Middle School (math 67% / reading 64%, grade A-, #95 of 571 statewide, top 17%, 506 students, 38% FRL); Melbourne Senior High School (math 43% / reading 57%, grade D+, #175 of 667 statewide, top 27%, 2,249 students, 31% FRL).
- Market conditions: 218 active listings in the ZIP; 14 comparable units currently listed for rent nearby; rentals at typical pace (median 24d on market — plan ~3-4 weeks tenant-placement turnaround); solid renter incomes; 4,602 units permitted in Brevard County in 2024 (702 in 5+ unit buildings).
- Brevard County population projected at +15% by 2050 — modest demand growth; plan on rents tracking national, not racing it.
- Current owner paid $270k; list at $439k implies a 63% gain — meaningful room to come down on a strong offer.
- Climate carrying-cost: severe wind risk, 99% chance of damaging wind over 30y; extreme-heat days projected 7→20/yr by 2055 (HVAC capex compounding) — expect insurance premiums to compound above CPI over the hold.
- At $4,449/mo this rent would consume 54% of the median local household income ($98k/yr) (locally 196% of renters already pay >50% of income on rent) — very limited rent-growth headroom before tenants either downsize or default.
Questions for listing agent
- What do current leases actually rent for vs. the listed asking? Can we see a recent rent roll and the last 12 months of T-12 income?
- It's been on market 102 days. Have you received any prior offers? Is the seller open to a 9% concession, seller financing, or rate buy-down credit?
- What does the HOA fee cover, when was the last increase, and are there any pending special assessments or reserve-fund shortfalls?
- Any open or pending special assessments — roof, HVAC, plumbing, elevator, façade? What's the per-unit balance and payoff schedule, and is the seller paying it off at close or rolling it to the buyer?
- Why hasn't it sold? Are there any deal-killer items the seller is aware of (foundation, flood, title, zoning, code violations)?
- Is there a deadline driving the sale (1031 exchange, divorce, estate, relocation)? That informs how much negotiation room exists.
- The area grade is low — what's the realistic commute time and amenity access for the typical tenant pool here? Any planned neighborhood developments (good or bad) we should know about?
- What's the average days-on-market for RENTAL listings here right now (not sales)? A rising rental-DOM trend means longer vacancies and softer asking-rent achievability than the comps imply.
CashFlowRE · CFR-CTBY4MDBFBJ4DY
· Data 2 days ago
cashflowre.app · 2026-05-29