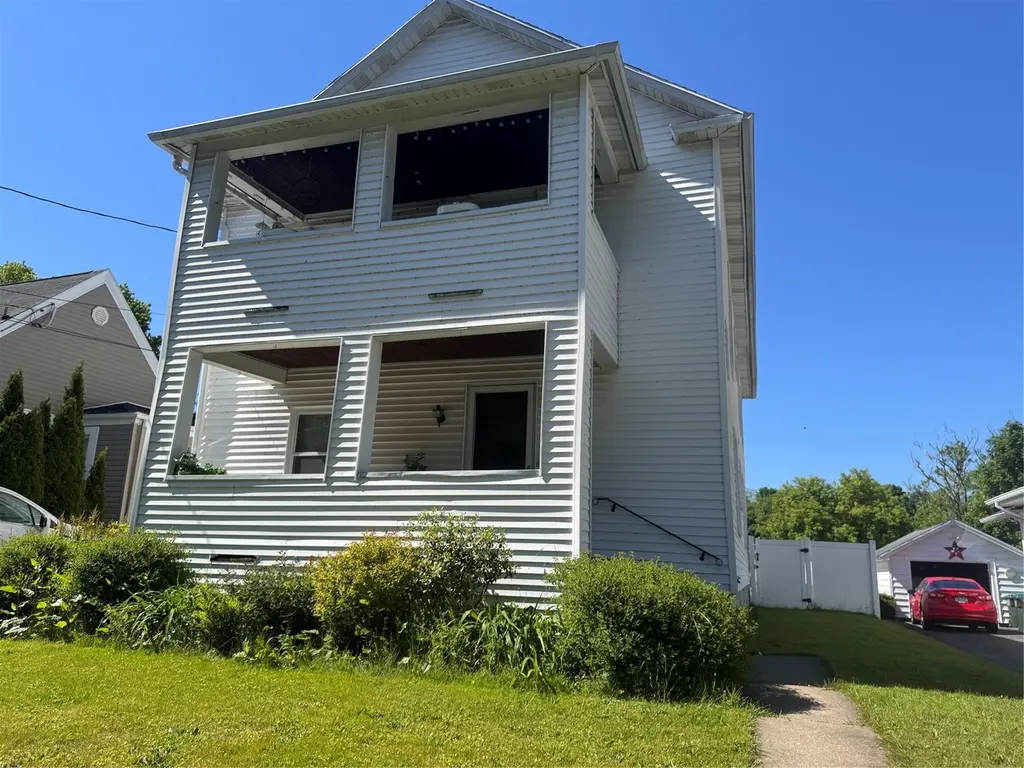
7 Hastings St
Port Dickinson, NY 13901
$181,000B-
3 bd · 2.0 ba ·
2,282 sqft ·
Built 1930
· MultiFamily
· Active
· 14 DOM
Cashflow @ list (25.0% down · 7.5%)
Estimated rent
$2,492/mo
Mortgage (P&I)
−$949
Tax + insurance
−$420
HOA
−$0
Vac / Maint / Mgmt
−$523
Net cashflow
$600/mo
Annual
$7,197/yr
Cap rate
10.27%
Cash-on-cash
14.20%
DSCR
1.63
1% rule
1.38%
Cash to close
$50,680
Investor read
- This is a 2 × 2-bed/1.0-bath units multifamily listed at $181k.
- At list price, monthly cash flow is $600 ($7k/yr) — positive. Per door: $300/mo.
- The deal already cash-flows at list — no discount required.
- Meets the 1% rule at list price ($2k rent vs $181k).
- Only 14 days on market — expect competitive offers; lowballing is unlikely to land.
- Local home prices are declining (-3.0%/yr); year-one equity from $1k of loan paydown is wiped out by about $5k of value loss. Plan a longer hold.
- Location reads 80/100 on livability (#119 in NY, #1,948 nationally) — a professional / high-income tenant draw. Strengths: cost of living A+, housing A+, health & safety A; Watch: amenities F.
- Chenango Valley Central School District (suburban): math 47% / reading 57% proficiency, ranked #339 of 590 in NY (top 58%) — acceptable for families but not a draw, mixed tenant base, ~2y average lease.
- Zoned schools: Port Dickinson Elementary School (408 students, 39% FRL).
- Watch-outs: built in 1930 — expect roof / HVAC / electrical / plumbing capex.
- Market conditions: 92 active listings in the ZIP; 1 comparable units currently listed for rent nearby; 340 units permitted in Broome County in 2024 (269 in 5+ unit buildings).
- Broome County population projected at -13% by 2050 — secular population decline; favor cash flow + early exit over multi-decade hold.
- 2 sale attempts since 13y ago with the ask held roughly flat each time — persistent listings suggest the price (not the market) is what's stuck; bring a comps-based counter.
- At projected returns (-3.0% appreciation + 3.0% rent growth), your $51k cash investment doubles in ~9 years — after that, you're playing with house money.
- At $2,492/mo this rent would consume 54% of the median local household income ($56k/yr) (locally 1230% of renters already pay >50% of income on rent) — very limited rent-growth headroom before tenants either downsize or default.
Questions for listing agent
- Can we see the unit-by-unit rent roll, current vacancy, and any below-market leases? What's the average tenancy length?
- What capital expenditures (roof, boiler, parking lot, exteriors) have been made in the last 5 years, and what's planned in the next 2?
- Built in 1930 — when were the roof, HVAC, electrical panel, plumbing, and water heater last replaced?
- Is there a deadline driving the sale (1031 exchange, divorce, estate, relocation)? That informs how much negotiation room exists.
- Schools are D-rated, which usually means shorter tenancies and higher turnover. Who's the typical renter profile here, and what's been the actual vacancy rate?
- What's the average days-on-market for RENTAL listings here right now (not sales)? A rising rental-DOM trend means longer vacancies and softer asking-rent achievability than the comps imply.
- What's the recent tenant-quality profile in this submarket — average credit score on applications, eviction rate, late-payment / NSF rate, and stable-employment percentage? A property-management company in the area should have these aggregated.
- How much new apartment / multifamily construction is in the pipeline within 1–3 miles? Heavy new supply (>2% of stock underway) typically softens rents 12–24 months out; light construction supports rent growth.
CashFlowRE · CFR-CTW4MK849AC746
· Data 1 day ago
cashflowre.app · 2026-05-29