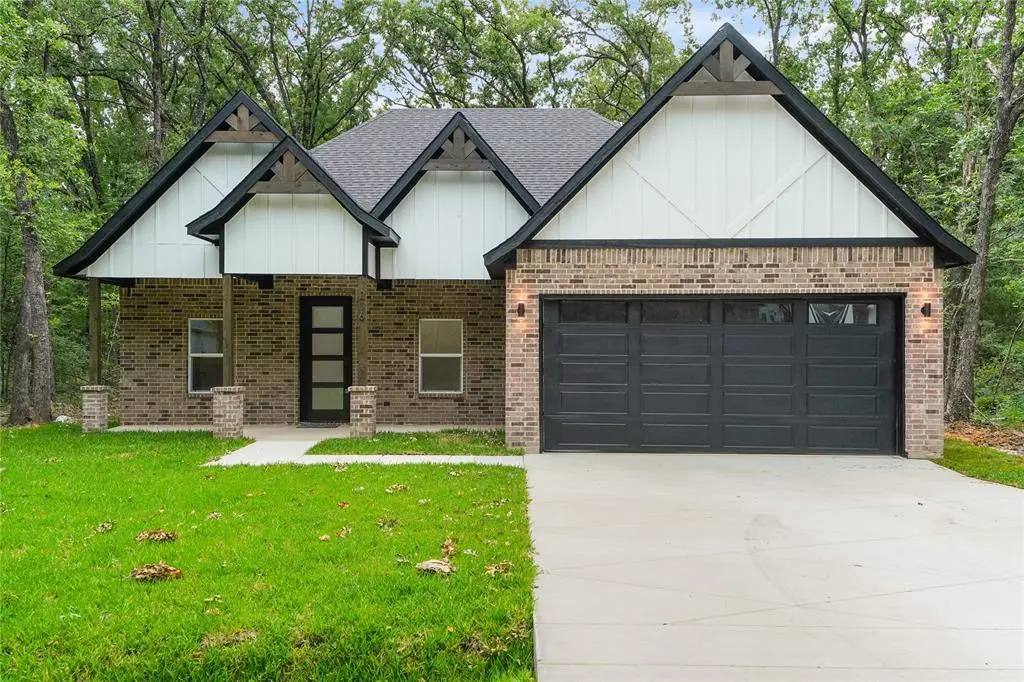
216 E Beachwood Loop
Tool, TX 75163
$307,900C
3 bd · 2.0 ba ·
1,618 sqft ·
Built 2026
· Land
· Active
· 63 DOM
Cashflow @ list (25.0% down · 7.5%)
Estimated rent
$3,575/mo
Mortgage (P&I)
−$1,615
Tax + insurance
−$513
HOA
−$23
Vac / Maint / Mgmt
−$751
Net cashflow
$673/mo
Annual
$8,078/yr
Cap rate
8.92%
Cash-on-cash
9.37%
DSCR
1.42
1% rule
1.16%
Cash to close
$86,212
Investor read
- This is a 3-bed/2.0-bath land listed at $308k.
- At list price, monthly cash flow is $673 ($8k/yr) — positive.
- The deal already cash-flows at list — no discount required.
- Meets the 1% rule at list price ($4k rent vs $308k).
- It's been on market 63 days — a 6% lower offer ($289k) is reasonable based on typical stale-listing flexibility.
- Recommended offer: $289k (6.0% below list) — sets the bar for market timing.
- In year one you build about $5k of equity ($2k loan paydown + $3k appreciation (1.0% local appreciation)).
- Location reads 66/100 on livability (#651 in TX) — a middle-class / working-renter tenant base. Strengths: crime A+, cost of living A+, housing A+; Watch: employment D, amenities F, commute F.
- Malakoff ISD (town): math 48% / reading 54% proficiency, ranked #187 of 826 in TX (top 23%) — acceptable for families but not a draw, mixed tenant base, ~2y average lease; 61% free/reduced lunch — lower-income household profile, screen leases tightly.
- Market conditions: 162 active listings in the ZIP; 3 comparable units currently listed for rent nearby; rentals lingering (median 44d on market — plan ~5-8 weeks vacancy on turnover, expect pricing pressure); 100% of comp listings sitting > 30 days — soft ceiling on asking rent; 263 units permitted in Henderson County in 2024 (0 in 5+ unit buildings).
- 3 sale attempts with the ask held roughly flat each time — persistent listings suggest the price (not the market) is what's stuck; bring a comps-based counter.
- At projected returns (1.0% appreciation + 3.0% rent growth), your $86k cash investment doubles in ~6 years — after that, you're playing with house money.
- By year 6, paydown + projected appreciation supports a ~$30k cash-out refi (75% LTV) — recoverable capital for the next deal without selling this one.
- Climate carrying-cost: major wind risk, 60% chance of damaging wind over 30y; extreme-heat days projected 7→25/yr by 2055 (HVAC capex compounding) — expect insurance premiums to compound above CPI over the hold.
- Cap rate 8.9% vs local median 2.8% in Tool — top-decile yield for the area; either an underpriced asset or a hidden risk that comps aren't pricing in. Stress-test before assuming the spread holds.
Questions for listing agent
- It's been on market 63 days. Have you received any prior offers? Is the seller open to a 6% concession, seller financing, or rate buy-down credit?
- What does the HOA fee cover, when was the last increase, and are there any pending special assessments or reserve-fund shortfalls?
- Why hasn't it sold? Are there any deal-killer items the seller is aware of (foundation, flood, title, zoning, code violations)?
- Is there a deadline driving the sale (1031 exchange, divorce, estate, relocation)? That informs how much negotiation room exists.
- What's the average days-on-market for RENTAL listings here right now (not sales)? A rising rental-DOM trend means longer vacancies and softer asking-rent achievability than the comps imply.
- What's the recent tenant-quality profile in this submarket — average credit score on applications, eviction rate, late-payment / NSF rate, and stable-employment percentage? A property-management company in the area should have these aggregated.
- How much new for-sale + rental construction is in the pipeline within 1–3 miles? Heavy new supply typically softens prices + rents 12–24 months out; constrained supply supports both.
CashFlowRE · CFR-CW2CPD2HPQG2VE
· Data 1 day ago
cashflowre.app · 2026-05-29