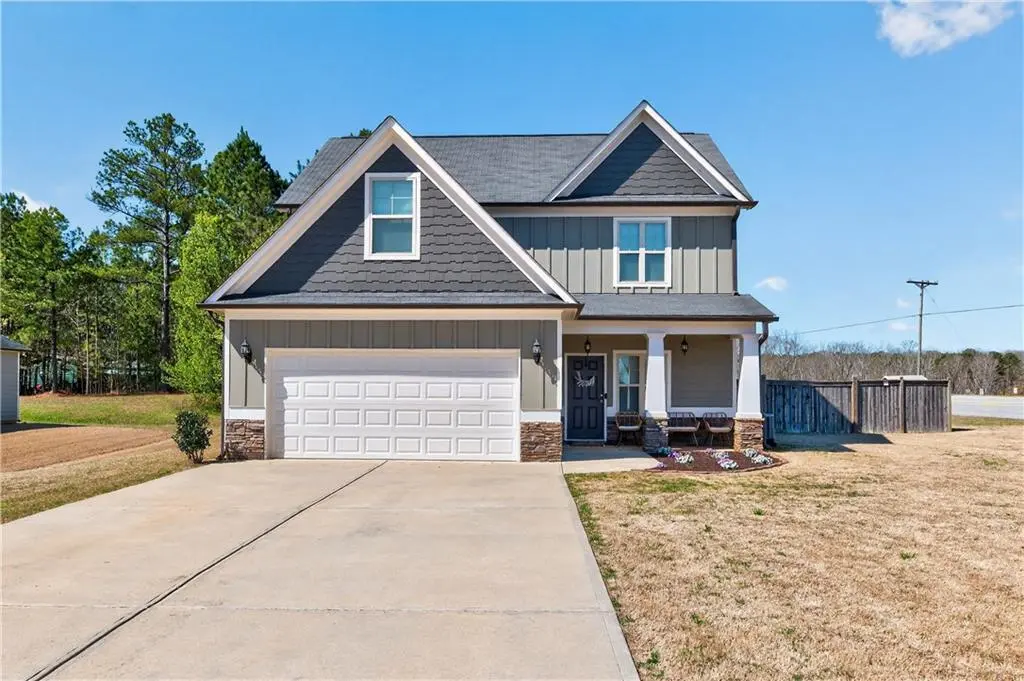
22 Ragan Dr
Villa Rica, GA 30157
$339,000D-
4 bd · 2.5 ba ·
1,993 sqft ·
Built 2019
· SingleFamily
· Active
· 91 DOM
Cashflow @ list (25.0% down · 7.5%)
Estimated rent
$2,477/mo
Mortgage (P&I)
−$1,778
Tax + insurance
−$400
HOA
−$0
Vac / Maint / Mgmt
−$520
Net cashflow
$-221/mo
Annual
$-2,652/yr
Cap rate
5.51%
Cash-on-cash
-2.79%
DSCR
0.88
1% rule
0.73%
Cash to close
$94,920
Investor read
- This is a 4-bed/2.5-bath single-family listed at $339k.
- At list price, monthly cash flow is $-221 ($-3k/yr) — negative.
- To cash-flow at today's rent, offer at most $300k (11.5% below list).
- To meet the 1% rule (rent ≥ 1% of price), the offer needs to be $248k (26.9% below list).
- It's been on market 91 days — a 9% lower offer ($308k) is reasonable based on typical stale-listing flexibility.
- Recommended offer: $248k (26.9% below list) — sets the bar for 1% rule.
- Local home prices are declining (-3.0%/yr); year-one equity from $2k of loan paydown is wiped out by about $10k of value loss. Plan a longer hold.
- Location reads 65/100 on livability (#224 in GA) — a middle-class / working-renter tenant base. Strengths: cost of living A+, housing A+, employment B; Watch: schools C-, amenities F, commute F.
- Paulding County (suburban): math 39% / reading 42% proficiency, ranked #33 of 174 in GA (top 19%) — families likely to look elsewhere, expect single-tenant / working-renter base with shorter leases.
- Market conditions: Rents soft (-2.8%/yr); 598 active listings in the ZIP; 2 comparable units currently listed for rent nearby; solid renter incomes; 1,458 units permitted in Paulding County in 2024 (0 in 5+ unit buildings).
- Paulding County population projected at +24% by 2050 — long-run rental-demand tailwind backs the buy-and-hold thesis.
- 3 sale attempts since 6y ago; this cycle's ask has dropped $31k (8%) from the opening price — seller is motivated, your offer sets the floor, not the list.
- Current owner paid $236k; 43% above their basis — modest negotiation headroom, anchor on the comps not their cost.
- Climate carrying-cost: moderate wind risk, 25% chance of damaging wind over 30y; extreme-heat days projected 7→20/yr by 2055 (HVAC capex compounding) — expect insurance premiums to compound above CPI over the hold.
- Cap rate 5.5% vs local median 4.0% in Villa Rica — top-decile yield for the area; either an underpriced asset or a hidden risk that comps aren't pricing in. Stress-test before assuming the spread holds.
- This rent runs 32% of the median local income ($94k/yr) — at the standard rent-burdened threshold; future hikes will face affordability resistance.
Questions for listing agent
- What do current leases actually rent for vs. the listed asking? Can we see a recent rent roll and the last 12 months of T-12 income?
- It's been on market 91 days. Have you received any prior offers? Is the seller open to a 27% concession, seller financing, or rate buy-down credit?
- Why hasn't it sold? Are there any deal-killer items the seller is aware of (foundation, flood, title, zoning, code violations)?
- Is there a deadline driving the sale (1031 exchange, divorce, estate, relocation)? That informs how much negotiation room exists.
- The area grade is low — what's the realistic commute time and amenity access for the typical tenant pool here? Any planned neighborhood developments (good or bad) we should know about?
- What's the average days-on-market for RENTAL listings here right now (not sales)? A rising rental-DOM trend means longer vacancies and softer asking-rent achievability than the comps imply.
- What's the recent tenant-quality profile in this submarket — average credit score on applications, eviction rate, late-payment / NSF rate, and stable-employment percentage? A property-management company in the area should have these aggregated.
- How much new for-sale + rental construction is in the pipeline within 1–3 miles? Heavy new supply typically softens prices + rents 12–24 months out; constrained supply supports both.
CashFlowRE · CFR-CW3Z8ECVYCWSDA
· Data 1 day ago
cashflowre.app · 2026-05-29