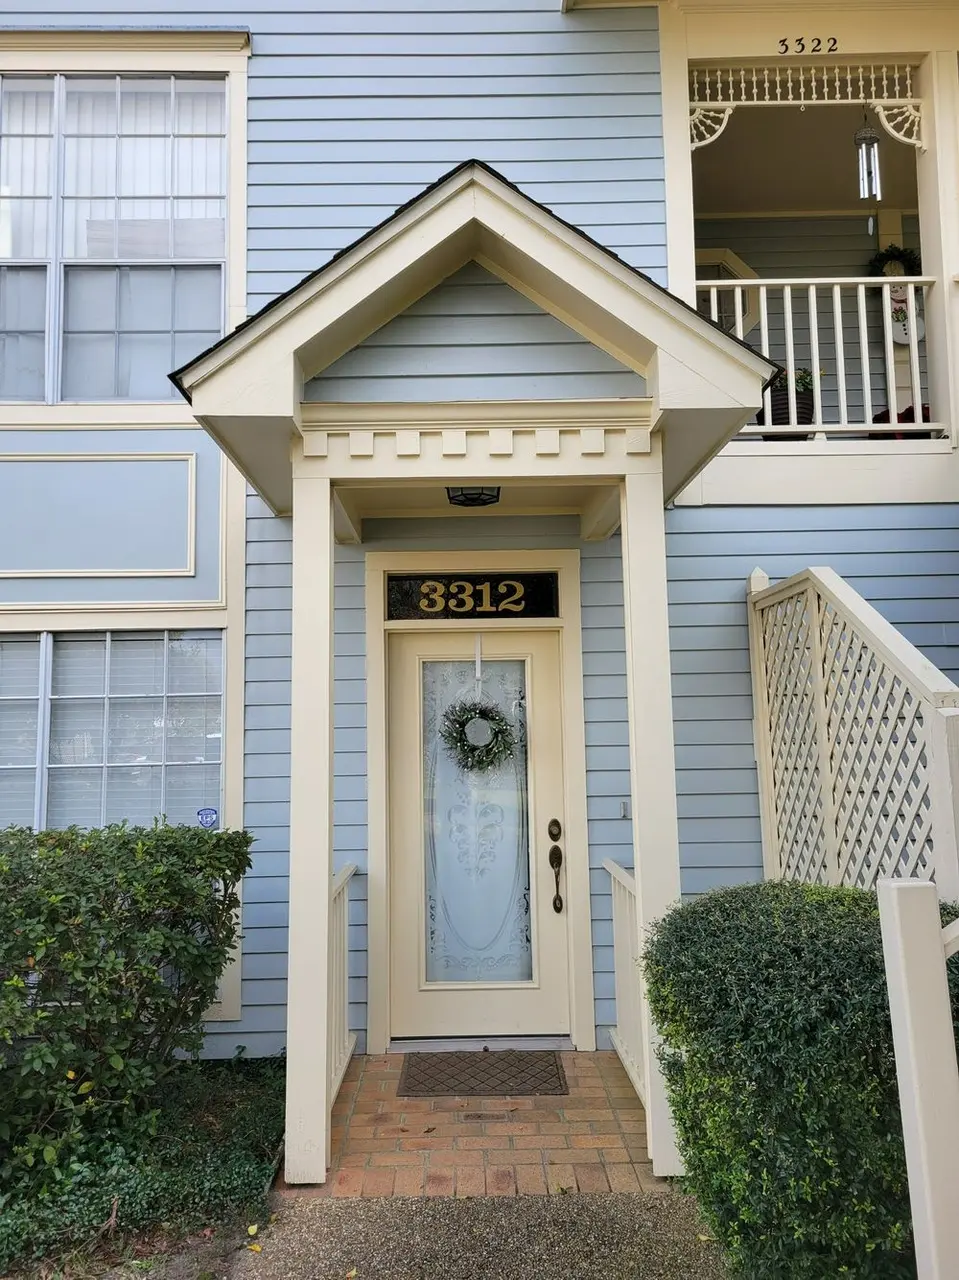
3312 Audubon Trce
Jefferson, LA 70121
$198,500F
1 bd · 1.0 ba ·
1,018 sqft ·
Built 1987
· Condo
· Active
· 154 DOM
Cashflow @ list (25.0% down · 7.5%)
Estimated rent
$1,560/mo
Mortgage (P&I)
−$1,041
Tax + insurance
−$331
HOA
−$483
Vac / Maint / Mgmt
−$328
Net cashflow
$-623/mo
Annual
$-7,472/yr
Cap rate
2.53%
Cash-on-cash
-13.44%
DSCR
0.40
1% rule
0.79%
Cash to close
$55,580
Investor read
- This is a 1-bed/1.0-bath condo listed at $198k.
- At list price, monthly cash flow is $-623 ($-7k/yr) — negative.
- To cash-flow at today's rent, offer at most $178k (10.2% below list).
- To meet the 1% rule (rent ≥ 1% of price), the offer needs to be $156k (21.4% below list).
- It's been on market 154 days — a 12% lower offer ($175k) is reasonable based on typical stale-listing flexibility.
- Recommended offer: $156k (21.4% below list) — sets the bar for 1% rule.
- Local home prices are declining (-3.0%/yr); year-one equity from $1k of loan paydown is wiped out by about $6k of value loss. Plan a longer hold.
- Location reads 72/100 on livability (#42 in LA) — a middle-class / working-renter tenant base. Strengths: cost of living A+, health & safety A+, housing A; Watch: employment D, amenities F, commute F.
- Jefferson Parish (suburban): math 24% / reading 34% proficiency, ranked #44 of 98 in LA (top 45%) — low school quality limits family demand, transient renter base, plan for 1-2y turnover; 70% free/reduced lunch — lower-income household profile, screen leases tightly.
- Watch-outs: HOA is 31% of rent.
- Market conditions: Rents rising fast (+5.1%/yr); 100 active listings in the ZIP; 40 comparable units currently listed for rent nearby; rentals at typical pace (median 22d on market — plan ~3-4 weeks tenant-placement turnaround); 518 units permitted in Jefferson Parish in 2024 (43 in 5+ unit buildings).
- 7 sale attempts since 30y ago with the ask held roughly flat each time — persistent listings suggest the price (not the market) is what's stuck; bring a comps-based counter.
- Current owner paid $153k; 30% above their basis — modest negotiation headroom, anchor on the comps not their cost.
- Climate carrying-cost: severe wind risk, 99% chance of damaging wind over 30y; extreme-heat days projected 7→21/yr by 2055 (HVAC capex compounding) — expect insurance premiums to compound above CPI over the hold.
- Cap rate 2.5% vs local median 4.6% in Jefferson — below-typical yield; the buyer is paying a premium for something (appreciation thesis, condition, location) that the cap rate doesn't capture.
- This rent runs 31% of the median local income ($60k/yr) — at the standard rent-burdened threshold; future hikes will face affordability resistance.
Questions for listing agent
- What do current leases actually rent for vs. the listed asking? Can we see a recent rent roll and the last 12 months of T-12 income?
- It's been on market 154 days. Have you received any prior offers? Is the seller open to a 21% concession, seller financing, or rate buy-down credit?
- What does the HOA fee cover, when was the last increase, and are there any pending special assessments or reserve-fund shortfalls?
- Any open or pending special assessments — roof, HVAC, plumbing, elevator, façade? What's the per-unit balance and payoff schedule, and is the seller paying it off at close or rolling it to the buyer?
- Why hasn't it sold? Are there any deal-killer items the seller is aware of (foundation, flood, title, zoning, code violations)?
- Is there a deadline driving the sale (1031 exchange, divorce, estate, relocation)? That informs how much negotiation room exists.
- The area grade is low — what's the realistic commute time and amenity access for the typical tenant pool here? Any planned neighborhood developments (good or bad) we should know about?
- What's the average days-on-market for RENTAL listings here right now (not sales)? A rising rental-DOM trend means longer vacancies and softer asking-rent achievability than the comps imply.
CashFlowRE · CFR-CWD9NQ8VV4YMDC
· Data 2 days ago
cashflowre.app · 2026-05-29