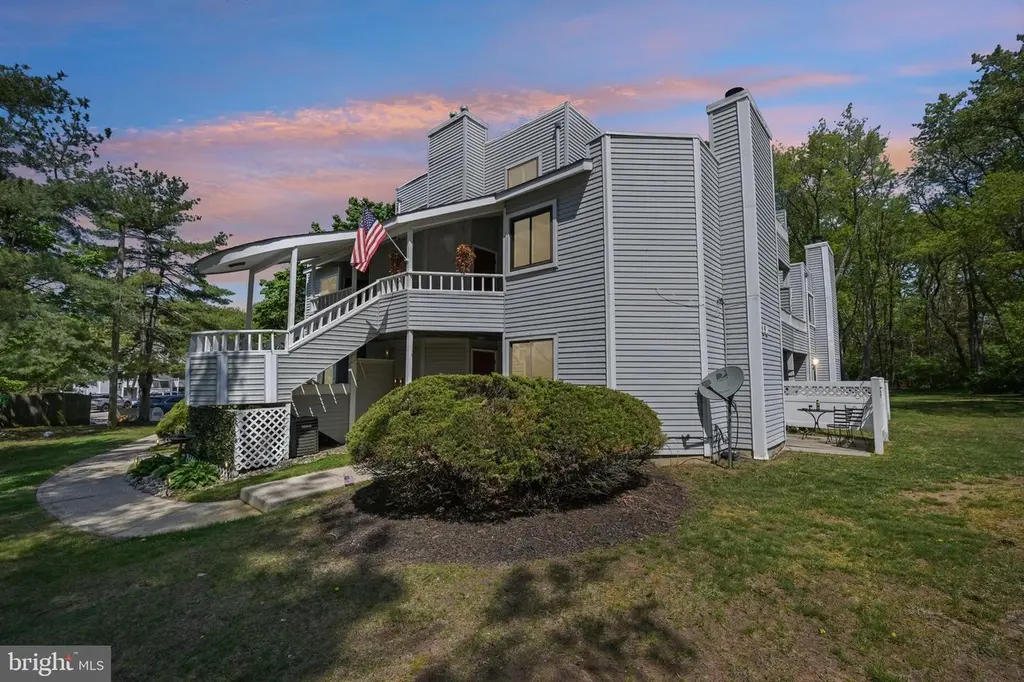
1408 Berwyck Ct
Sicklerville, NJ 08081
$225,000D-
2 bd · 2.0 ba ·
908 sqft ·
Built 1983
· SingleFamily
· Pending
· 43 DOM
Cashflow @ list (25.0% down · 7.5%)
Estimated rent
$2,159/mo
Mortgage (P&I)
−$1,180
Tax + insurance
−$337
HOA
−$220
Vac / Maint / Mgmt
−$453
Net cashflow
$-31/mo
Annual
$-372/yr
Cap rate
6.13%
Cash-on-cash
-0.59%
DSCR
0.97
1% rule
0.96%
Cash to close
$63,000
Investor read
- This is a 2-bed/2.0-bath single-family listed at $225k.
- At list price, monthly cash flow is $-31 ($-372/yr) — negative.
- To cash-flow at today's rent, offer at most $220k (2.4% below list).
- To meet the 1% rule (rent ≥ 1% of price), the offer needs to be $216k (4.0% below list).
- It's been on market 43 days — a 3% lower offer ($218k) is reasonable based on typical stale-listing flexibility.
- Recommended offer: $216k (4.0% below list) — sets the bar for 1% rule.
- Local home prices are declining (-3.0%/yr); year-one equity from $2k of loan paydown is wiped out by about $7k of value loss. Plan a longer hold.
- Location reads: area grade D — affects rentability + tenant quality, not the cash-flow math above.
- Gloucester Township Public Schools (suburban): math 14% / reading 41% proficiency, ranked #351 of 472 in NJ (top 74%) — low school quality limits family demand, transient renter base, plan for 1-2y turnover.
- Market conditions: Rents rising (+3.4%/yr); 329 active listings in the ZIP; 8 comparable units currently listed for rent nearby; rentals at typical pace (median 16d on market — plan ~3-4 weeks tenant-placement turnaround); solid renter incomes; 1,018 units permitted in Camden County in 2024 (509 in 5+ unit buildings).
- Camden County population projected to shrink 8% by 2050 — rents likely to lag national; underwrite the cash flow, not the appreciation.
- 3 sale attempts since 8y ago; this cycle's ask has dropped $15k (6%) from the opening price — seller is motivated, your offer sets the floor, not the list.
- Current owner paid $66k; list at $225k implies a 241% gain — meaningful room to come down on a strong offer.
- Climate carrying-cost: major wind risk, 69% chance of damaging wind over 30y; extreme-heat days projected 7→15/yr by 2055 (HVAC capex compounding) — expect insurance premiums to compound above CPI over the hold.
- Cap rate 6.1% vs local median 4.7% in Sicklerville — top-decile yield for the area; either an underpriced asset or a hidden risk that comps aren't pricing in. Stress-test before assuming the spread holds.
Questions for listing agent
- What do current leases actually rent for vs. the listed asking? Can we see a recent rent roll and the last 12 months of T-12 income?
- It's been on market 43 days. Have you received any prior offers? Is the seller open to a 4% concession, seller financing, or rate buy-down credit?
- What does the HOA fee cover, when was the last increase, and are there any pending special assessments or reserve-fund shortfalls?
- Is there a deadline driving the sale (1031 exchange, divorce, estate, relocation)? That informs how much negotiation room exists.
- The area grade is low — what's the realistic commute time and amenity access for the typical tenant pool here? Any planned neighborhood developments (good or bad) we should know about?
- What's the average days-on-market for RENTAL listings here right now (not sales)? A rising rental-DOM trend means longer vacancies and softer asking-rent achievability than the comps imply.
- What's the recent tenant-quality profile in this submarket — average credit score on applications, eviction rate, late-payment / NSF rate, and stable-employment percentage? A property-management company in the area should have these aggregated.
- How much new for-sale + rental construction is in the pipeline within 1–3 miles? Heavy new supply typically softens prices + rents 12–24 months out; constrained supply supports both.
CashFlowRE · CFR-CYWB6HF8XG9FFN
· Data 1 week ago
cashflowre.app · 2026-05-29