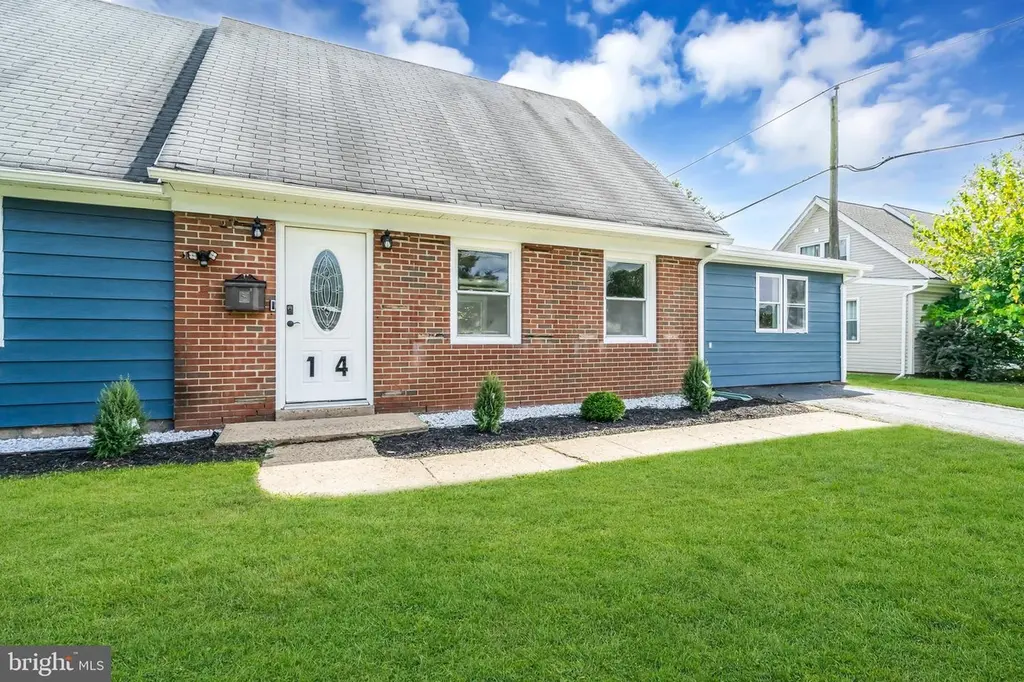
14 Melbourne Ln
Beverly, NJ 08046
$398,000F
4 bd · 2.0 ba ·
1,737 sqft ·
Built 1961
· SingleFamily
· Pending
· 90 DOM
Cashflow @ list (25.0% down · 7.5%)
Estimated rent
$3,574/mo
Mortgage (P&I)
−$2,087
Tax + insurance
−$701
HOA
−$0
Vac / Maint / Mgmt
−$751
Net cashflow
$35/mo
Annual
$423/yr
Cap rate
6.40%
Cash-on-cash
0.38%
DSCR
1.02
1% rule
0.90%
Cash to close
$111,440
Investor read
- This is a 4-bed/2.0-bath single-family listed at $398k.
- At list price, monthly cash flow is $35 ($423/yr) — positive.
- The deal already cash-flows at list — no discount required.
- To meet the 1% rule (rent ≥ 1% of price), the offer needs to be $357k (10.2% below list).
- It's been on market 90 days — a 6% lower offer ($374k) is reasonable based on typical stale-listing flexibility.
- Recommended offer: $357k (10.2% below list) — sets the bar for 1% rule.
- Local home prices are declining (-3.0%/yr); year-one equity from $3k of loan paydown is wiped out by about $12k of value loss. Plan a longer hold.
- Location reads 76/100 on livability (#130 in NJ, #3,487 nationally) — a middle-class / working-renter tenant base. Strengths: employment A+, housing A+, commute A; Watch: schools C-, amenities F.
- Willingboro Public School District (suburban): math 5% / reading 30% proficiency, ranked #433 of 472 in NJ (top 92%) — low school quality limits family demand, transient renter base, plan for 1-2y turnover.
- Market conditions: 151 active listings in the ZIP; 15 comparable units currently listed for rent nearby; rentals leasing fast (median 2d on market — plan ~1-2 weeks tenant-placement turnaround); solid renter incomes; 2,161 units permitted in Burlington County in 2024 (988 in 5+ unit buildings).
- Burlington County population projected to shrink 5% by 2050 — rents likely to lag national; underwrite the cash flow, not the appreciation.
- 7 sale attempts since 22y ago with the ask held roughly flat each time — persistent listings suggest the price (not the market) is what's stuck; bring a comps-based counter.
- Current owner paid $220k; list at $398k implies a 81% gain — meaningful room to come down on a strong offer.
- Climate carrying-cost: major wind risk, 52% chance of damaging wind over 30y; extreme-heat days projected 7→15/yr by 2055 (HVAC capex compounding) — expect insurance premiums to compound above CPI over the hold.
- Cap rate 6.4% vs local median 4.9% in Beverly — meaningfully above typical; check what's discounted (condition, days-on-market, listing class) to confirm the premium yield is real.
- This rent runs 44% of the median local income ($98k/yr) — at the standard rent-burdened threshold; future hikes will face affordability resistance.
Questions for listing agent
- It's been on market 90 days. Have you received any prior offers? Is the seller open to a 10% concession, seller financing, or rate buy-down credit?
- Built in 1961 — when were the roof, HVAC, electrical panel, plumbing, and water heater last replaced?
- Why hasn't it sold? Are there any deal-killer items the seller is aware of (foundation, flood, title, zoning, code violations)?
- Is there a deadline driving the sale (1031 exchange, divorce, estate, relocation)? That informs how much negotiation room exists.
- The area grade is low — what's the realistic commute time and amenity access for the typical tenant pool here? Any planned neighborhood developments (good or bad) we should know about?
- What's the average days-on-market for RENTAL listings here right now (not sales)? A rising rental-DOM trend means longer vacancies and softer asking-rent achievability than the comps imply.
- What's the recent tenant-quality profile in this submarket — average credit score on applications, eviction rate, late-payment / NSF rate, and stable-employment percentage? A property-management company in the area should have these aggregated.
- How much new for-sale + rental construction is in the pipeline within 1–3 miles? Heavy new supply typically softens prices + rents 12–24 months out; constrained supply supports both.
CashFlowRE · CFR-CYYHWXCWS96ZFT
· Data 3 weeks ago
cashflowre.app · 2026-05-29