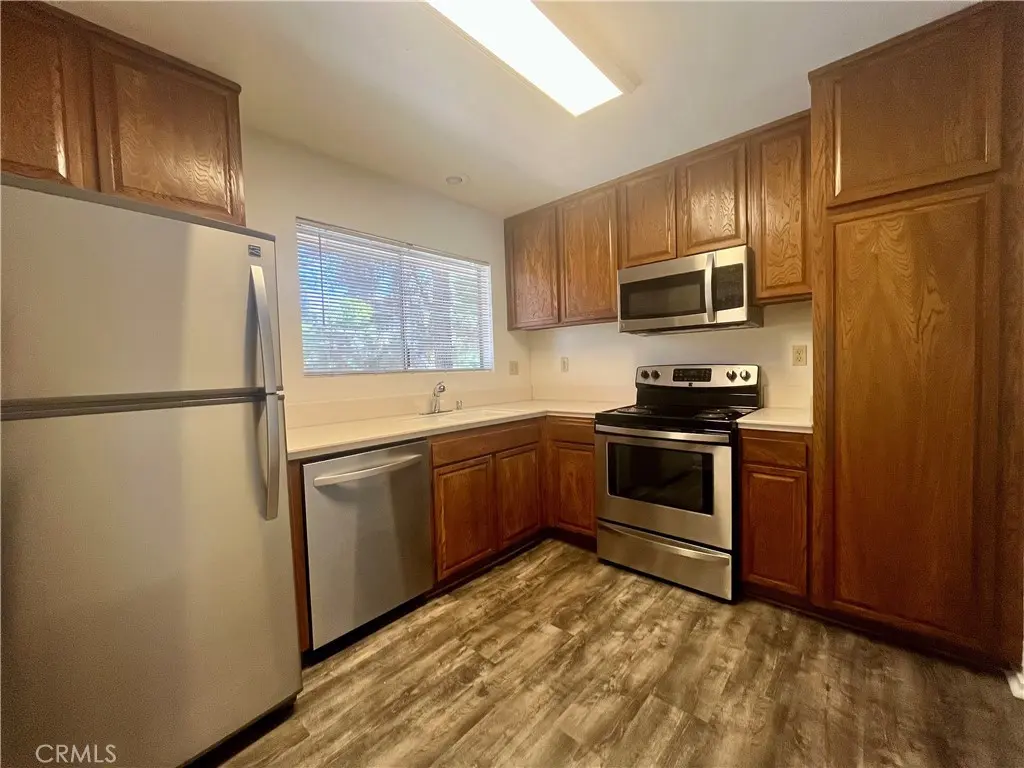
5368 Algarrobo Unit 2F
Laguna Woods, CA 92637
$305,000C
2 bd · 2.0 ba ·
894 sqft ·
Built 1973
· Condo
· Active
· 319 DOM
Cashflow @ list (25.0% down · 7.5%)
Estimated rent
$3,114/mo
Mortgage (P&I)
−$1,599
Tax + insurance
−$196
HOA
−$873
Vac / Maint / Mgmt
−$654
Net cashflow
$-209/mo
Annual
$-2,502/yr
Cap rate
5.47%
Cash-on-cash
-2.93%
DSCR
0.87
1% rule
1.02%
Cash to close
$85,400
Investor read
- This is a 2-bed/2.0-bath condo listed at $305k.
- At list price, monthly cash flow is $-209 ($-3k/yr) — negative.
- To cash-flow at today's rent, offer at most $268k (12.1% below list).
- Meets the 1% rule at list price ($3k rent vs $305k).
- It's been on market 319 days — a 12% lower offer ($268k) is reasonable based on typical stale-listing flexibility.
- Recommended offer: $268k (12.1% below list) — sets the bar for cash-flow.
- In year one you build about $20k of equity ($2k loan paydown + $18k appreciation (5.9% local appreciation)).
- Location reads 72/100 on livability (#200 in CA) — a middle-class / working-renter tenant base. Strengths: crime A+, commute A+; Watch: schools C-, amenities D+, cost of living F.
- Saddleback Valley Unified (suburban): math 51% / reading 73% proficiency, ranked #67 of 517 in CA (top 13%) — acceptable for families but not a draw, mixed tenant base, ~2y average lease.
- Watch-outs: HOA is 28% of rent.
- Market conditions: Rents rising fast (+6.8%/yr); 191 active listings in the ZIP; 17 comparable units currently listed for rent nearby; rentals at typical pace (median 25d on market — plan ~3-4 weeks tenant-placement turnaround); 6,974 units permitted in Orange County in 2024 (3,839 in 5+ unit buildings).
- Orange County population projected at +14% by 2050 — modest demand growth; plan on rents tracking national, not racing it.
- 3 sale attempts with the ask held roughly flat each time — persistent listings suggest the price (not the market) is what's stuck; bring a comps-based counter.
- Current owner paid $34k; list at $305k implies a 784% gain — meaningful room to come down on a strong offer.
- By year 2, paydown + projected appreciation supports a ~$32k cash-out refi (75% LTV) — recoverable capital for the next deal without selling this one.
- Cap rate 5.5% vs local median 2.4% in Laguna Woods — top-decile yield for the area; either an underpriced asset or a hidden risk that comps aren't pricing in. Stress-test before assuming the spread holds.
- At $3,114/mo this rent would consume 63% of the median local household income ($59k/yr) (locally 1572% of renters already pay >50% of income on rent) — very limited rent-growth headroom before tenants either downsize or default.
Questions for listing agent
- What do current leases actually rent for vs. the listed asking? Can we see a recent rent roll and the last 12 months of T-12 income?
- It's been on market 319 days. Have you received any prior offers? Is the seller open to a 12% concession, seller financing, or rate buy-down credit?
- Built in 1973 — when were the roof, HVAC, electrical panel, plumbing, and water heater last replaced?
- What does the HOA fee cover, when was the last increase, and are there any pending special assessments or reserve-fund shortfalls?
- Any open or pending special assessments — roof, HVAC, plumbing, elevator, façade? What's the per-unit balance and payoff schedule, and is the seller paying it off at close or rolling it to the buyer?
- Why hasn't it sold? Are there any deal-killer items the seller is aware of (foundation, flood, title, zoning, code violations)?
- Is there a deadline driving the sale (1031 exchange, divorce, estate, relocation)? That informs how much negotiation room exists.
- What's the average days-on-market for RENTAL listings here right now (not sales)? A rising rental-DOM trend means longer vacancies and softer asking-rent achievability than the comps imply.
CashFlowRE · CFR-D1778TA77RG02G
· Data 2 days ago
cashflowre.app · 2026-05-29