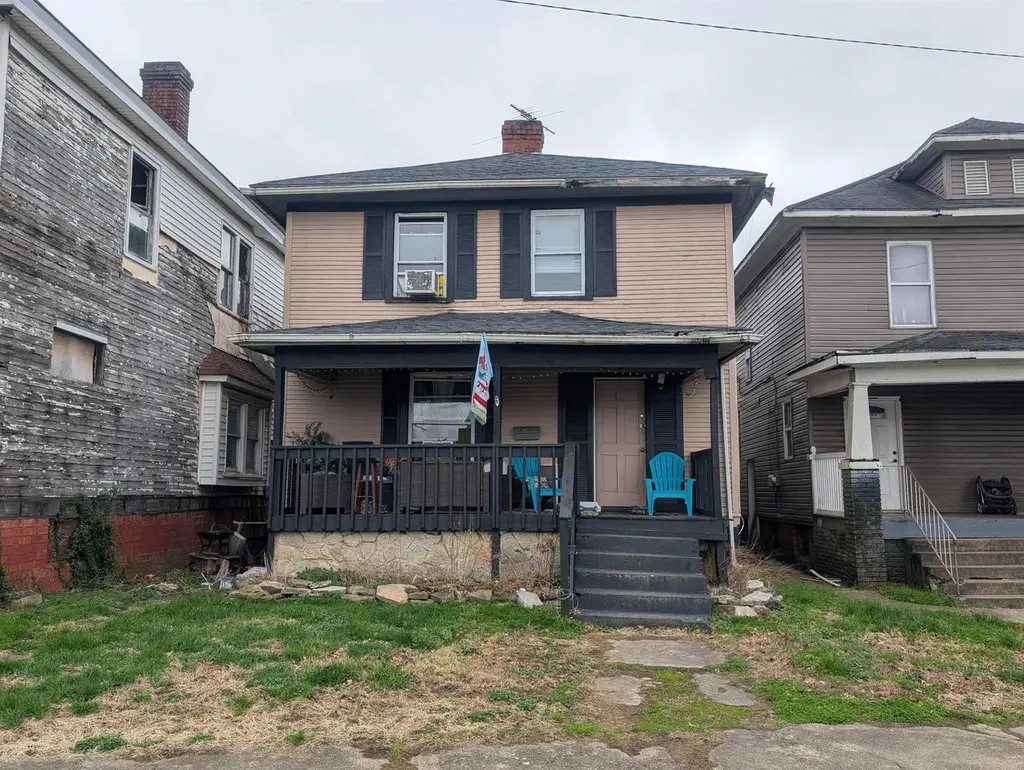
1706 Jackson St
Portsmouth, OH 45662
$34,900C-
3 bd · 1.0 ba ·
1,344 sqft ·
Built 1925
· SingleFamily
· Active
· 57 DOM
Cashflow @ list (25.0% down · 7.5%)
Estimated rent
$1,627/mo
Mortgage (P&I)
−$183
Tax + insurance
−$94
HOA
−$0
Vac / Maint / Mgmt
−$342
Net cashflow
$1,008/mo
Annual
$12,100/yr
Cap rate
40.96%
Cash-on-cash
123.83%
DSCR
6.51
1% rule
4.66%
Cash to close
$9,772
Investor read
- This is a 3-bed/1.0-bath single-family listed at $35k.
- At list price, monthly cash flow is $1k ($12k/yr) — positive.
- The deal already cash-flows at list — no discount required.
- Meets the 1% rule at list price ($2k rent vs $35k).
- It's been on market 57 days — a 3% lower offer ($34k) is reasonable based on typical stale-listing flexibility.
- Recommended offer: $34k (3.0% below list) — sets the bar for market timing.
- Local home prices are declining (-3.0%/yr); year-one equity from $241 of loan paydown is wiped out by about $1k of value loss. Plan a longer hold.
- Location reads 73/100 on livability (#327 in OH) — a middle-class / working-renter tenant base. Strengths: amenities A+, cost of living A+, health & safety A+; Watch: crime F, commute F, employment F.
- Portsmouth City (town): math 23% / reading 31% proficiency, ranked #601 of 656 in OH (top 92%) — low school quality limits family demand, transient renter base, plan for 1-2y turnover; 74% free/reduced lunch — lower-income household profile, screen leases tightly.
- Watch-outs: property tax is 2.7% of price; built in 1925 — expect roof / HVAC / electrical / plumbing capex.
- Market conditions: 16 active listings in the ZIP; 3 comparable units currently listed for rent nearby; rentals at typical pace (median 19d on market — plan ~3-4 weeks tenant-placement turnaround); lower-income renter base — watch delinquency; 8 units permitted in Scioto County in 2024 (0 in 5+ unit buildings).
- Scioto County population projected at -24% by 2050 — secular population decline; favor cash flow + early exit over multi-decade hold.
- 2 sale attempts; this cycle's ask has dropped $5k (13%) from the opening price — seller is motivated, your offer sets the floor, not the list.
- At projected returns (-3.0% appreciation + 3.0% rent growth), your $10k cash investment doubles in ~1 year — after that, you're playing with house money.
- Climate carrying-cost: extreme-heat days projected 7→19/yr by 2055 (HVAC capex compounding) — expect insurance premiums to compound above CPI over the hold.
- At $1,627/mo this rent would consume 52% of the median local household income ($37k/yr) — very limited rent-growth headroom before tenants either downsize or default.
Questions for listing agent
- It's been on market 57 days. Have you received any prior offers? Is the seller open to a 3% concession, seller financing, or rate buy-down credit?
- Built in 1925 — when were the roof, HVAC, electrical panel, plumbing, and water heater last replaced?
- Property tax is high relative to price — has the assessment been appealed recently, and will the sale trigger a re-assessment?
- Is there a deadline driving the sale (1031 exchange, divorce, estate, relocation)? That informs how much negotiation room exists.
- Crime grade is F in this area — have there been break-ins, vandalism, or insurance claims at this property in the last 3 years? What carrier currently insures it and at what premium?
- What's the average days-on-market for RENTAL listings here right now (not sales)? A rising rental-DOM trend means longer vacancies and softer asking-rent achievability than the comps imply.
- What's the recent tenant-quality profile in this submarket — average credit score on applications, eviction rate, late-payment / NSF rate, and stable-employment percentage? A property-management company in the area should have these aggregated.
- How much new for-sale + rental construction is in the pipeline within 1–3 miles? Heavy new supply typically softens prices + rents 12–24 months out; constrained supply supports both.
CashFlowRE · CFR-D2MHJW7WMR0PWD
· Data 2 days ago
cashflowre.app · 2026-05-29