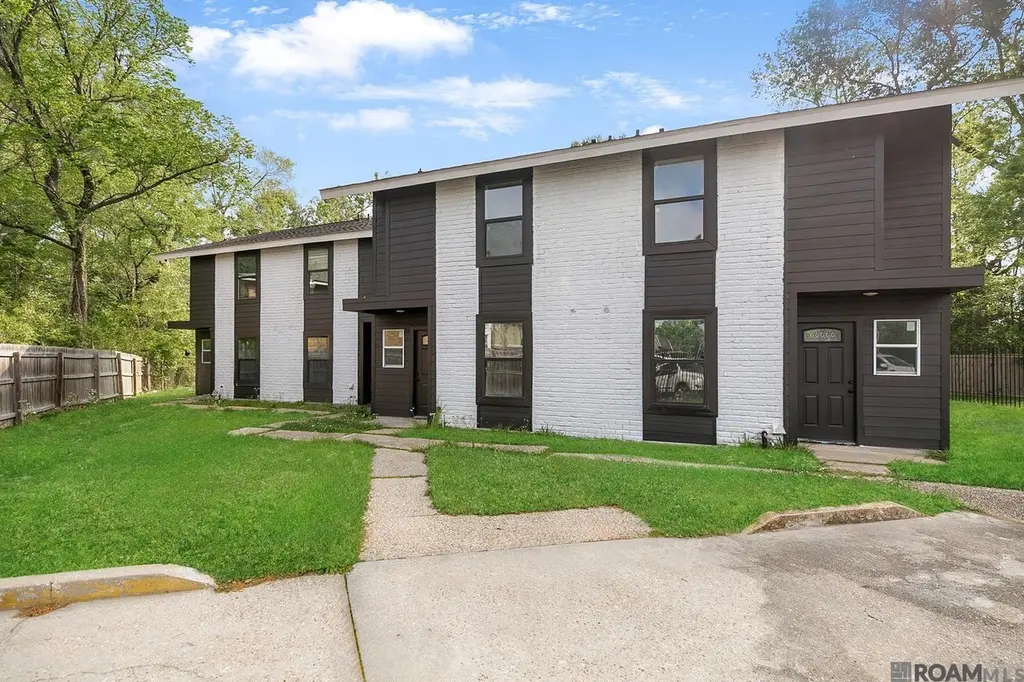
2015 Sherwood Meadow Dr
Baton Rouge, LA 70815
$415,000C-
8 bd · 6.0 ba ·
4,520 sqft ·
Built —
· MultiFamily
· Active
· 32 DOM
Cashflow @ list (25.0% down · 7.5%)
Estimated rent
$4,351/mo
Mortgage (P&I)
−$2,176
Tax + insurance
−$692
HOA
−$0
Vac / Maint / Mgmt
−$914
Net cashflow
$569/mo
Annual
$6,832/yr
Cap rate
7.94%
Cash-on-cash
5.88%
DSCR
1.26
1% rule
1.05%
Cash to close
$116,200
Investor read
- This is a 4 × 2.0-bed/1.5-bath units multifamily listed at $415k. Condition is rated good.
- At list price, monthly cash flow is $569 ($7k/yr) — positive. Per door: $142/mo.
- The deal already cash-flows at list — no discount required.
- Meets the 1% rule at list price ($4k rent vs $415k).
- It's been on market 32 days — a 3% lower offer ($403k) is reasonable based on typical stale-listing flexibility.
- Recommended offer: $403k (3.0% below list) — sets the bar for market timing.
- Local home prices are declining (-3.0%/yr); year-one equity from $3k of loan paydown is wiped out by about $12k of value loss. Plan a longer hold.
- Location reads 74/100 on livability (#24 in LA, #4,535 nationally) — a middle-class / working-renter tenant base. Strengths: commute A+, cost of living A+, health & safety A+; Watch: amenities D, crime F, employment D-.
- East Baton Rouge Parish (urban): math 22% / reading 34% proficiency, ranked #47 of 98 in LA (top 48%) — low school quality limits family demand, transient renter base, plan for 1-2y turnover; 77% free/reduced lunch — lower-income household profile, screen leases tightly.
- Market conditions: 165 active listings in the ZIP; 2,252 units permitted in East Baton Rouge Parish in 2024 (440 in 5+ unit buildings).
- East Baton Rouge County population projected at +4% by 2050 — modest demand growth; plan on rents tracking national, not racing it.
- 3 sale attempts since 29y ago; this cycle's ask is 4% above the opening price — seller raised mid-cycle; expect resistance to lowballs.
- Cap rate 7.9% vs local median 4.3% in Baton Rouge — top-decile yield for the area; either an underpriced asset or a hidden risk that comps aren't pricing in. Stress-test before assuming the spread holds.
- At $4,351/mo this rent would consume 88% of the median local household income ($59k/yr) (locally 1461% of renters already pay >50% of income on rent) — very limited rent-growth headroom before tenants either downsize or default.
Questions for listing agent
- It's been on market 32 days. Have you received any prior offers? Is the seller open to a 3% concession, seller financing, or rate buy-down credit?
- Can we see the unit-by-unit rent roll, current vacancy, and any below-market leases? What's the average tenancy length?
- What capital expenditures (roof, boiler, parking lot, exteriors) have been made in the last 5 years, and what's planned in the next 2?
- Is there a deadline driving the sale (1031 exchange, divorce, estate, relocation)? That informs how much negotiation room exists.
- Crime grade is F in this area — have there been break-ins, vandalism, or insurance claims at this property in the last 3 years? What carrier currently insures it and at what premium?
- What's the average days-on-market for RENTAL listings here right now (not sales)? A rising rental-DOM trend means longer vacancies and softer asking-rent achievability than the comps imply.
- What's the recent tenant-quality profile in this submarket — average credit score on applications, eviction rate, late-payment / NSF rate, and stable-employment percentage? A property-management company in the area should have these aggregated.
- How much new apartment / multifamily construction is in the pipeline within 1–3 miles? Heavy new supply (>2% of stock underway) typically softens rents 12–24 months out; light construction supports rent growth.
CashFlowRE · CFR-DB5EV4E77EA1NT
· Data 3 days ago
cashflowre.app · 2026-05-29