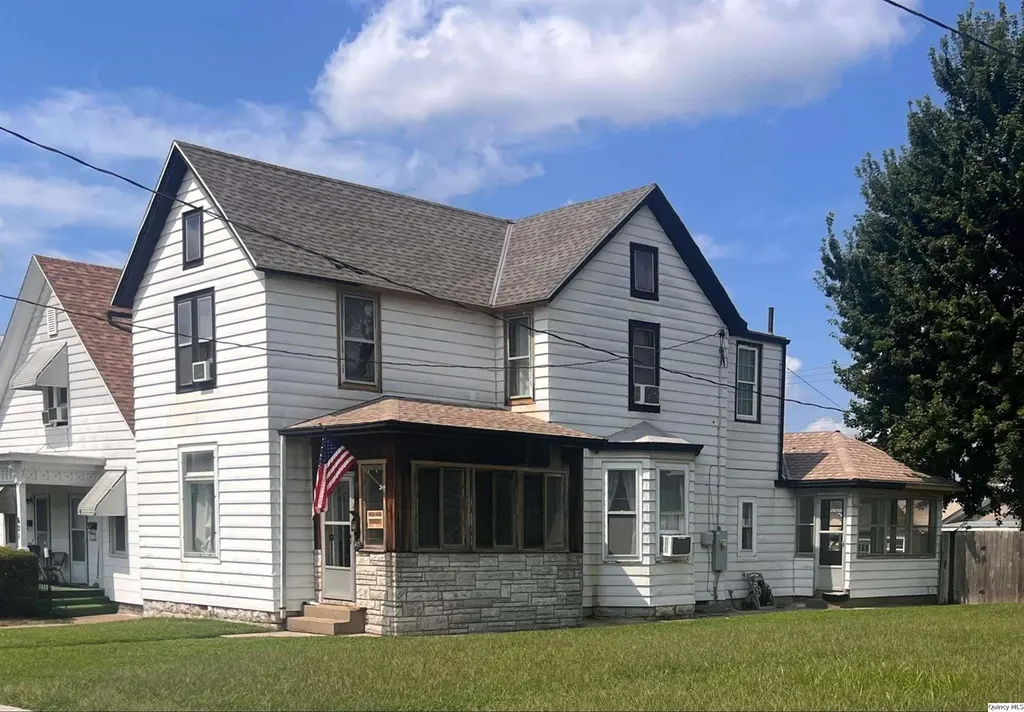
623 Payson Ave
Quincy, IL 62301
$109,000C+
3 bd · 2.0 ba ·
1,832 sqft ·
Built 1887
· SingleFamily
· Active
· 298 DOM
Cashflow @ list (25.0% down · 7.5%)
Estimated rent
$2,081/mo
Mortgage (P&I)
−$572
Tax + insurance
−$113
HOA
−$0
Vac / Maint / Mgmt
−$437
Net cashflow
$959/mo
Annual
$11,513/yr
Cap rate
16.86%
Cash-on-cash
37.72%
DSCR
2.68
1% rule
1.91%
Cash to close
$30,520
Investor read
- This is a 3-bed/2.0-bath single-family listed at $109k.
- At list price, monthly cash flow is $959 ($12k/yr) — positive.
- The deal already cash-flows at list — no discount required.
- Meets the 1% rule at list price ($2k rent vs $109k).
- It's been on market 298 days — a 12% lower offer ($96k) is reasonable based on typical stale-listing flexibility.
- Recommended offer: $96k (12.0% below list) — sets the bar for market timing.
- Local home prices are declining (-3.0%/yr); year-one equity from $754 of loan paydown is wiped out by about $3k of value loss. Plan a longer hold.
- Location reads 67/100 on livability (#506 in IL) — a middle-class / working-renter tenant base. Strengths: cost of living A+, housing A+; Watch: schools D+, crime D, employment D.
- Quincy SD 172 (town): math 24% / reading 27% proficiency, ranked #328 of 620 in IL (top 53%) — low school quality limits family demand, transient renter base, plan for 1-2y turnover.
- Watch-outs: built in 1887 — expect roof / HVAC / electrical / plumbing capex.
- Market conditions: Rents rising fast (+10.8%/yr); 180 active listings in the ZIP; 2 comparable units currently listed for rent nearby; 68 units permitted in Adams County in 2024 (0 in 5+ unit buildings).
- Adams County population projected at -14% by 2050 — secular population decline; favor cash flow + early exit over multi-decade hold.
- 12 sale attempts since 13y ago; this cycle's ask is 4% above the opening price — seller raised mid-cycle; expect resistance to lowballs.
- At projected returns (-3.0% appreciation + 8.0% rent growth), your $31k cash investment doubles in ~3 years — after that, you're playing with house money.
- Cap rate 16.9% vs local median 4.3% in Quincy — top-decile yield for the area; either an underpriced asset or a hidden risk that comps aren't pricing in. Stress-test before assuming the spread holds.
- At $2,081/mo this rent would consume 48% of the median local household income ($52k/yr) (locally 1238% of renters already pay >50% of income on rent) — very limited rent-growth headroom before tenants either downsize or default.
Questions for listing agent
- It's been on market 298 days. Have you received any prior offers? Is the seller open to a 12% concession, seller financing, or rate buy-down credit?
- Built in 1887 — when were the roof, HVAC, electrical panel, plumbing, and water heater last replaced?
- Why hasn't it sold? Are there any deal-killer items the seller is aware of (foundation, flood, title, zoning, code violations)?
- Is there a deadline driving the sale (1031 exchange, divorce, estate, relocation)? That informs how much negotiation room exists.
- Schools are D-rated, which usually means shorter tenancies and higher turnover. Who's the typical renter profile here, and what's been the actual vacancy rate?
- Crime grade is D in this area — have there been break-ins, vandalism, or insurance claims at this property in the last 3 years? What carrier currently insures it and at what premium?
- What's the average days-on-market for RENTAL listings here right now (not sales)? A rising rental-DOM trend means longer vacancies and softer asking-rent achievability than the comps imply.
- What's the recent tenant-quality profile in this submarket — average credit score on applications, eviction rate, late-payment / NSF rate, and stable-employment percentage? A property-management company in the area should have these aggregated.
CashFlowRE · CFR-DBKAE4F47G01TE
· Data 1 day ago
cashflowre.app · 2026-05-29