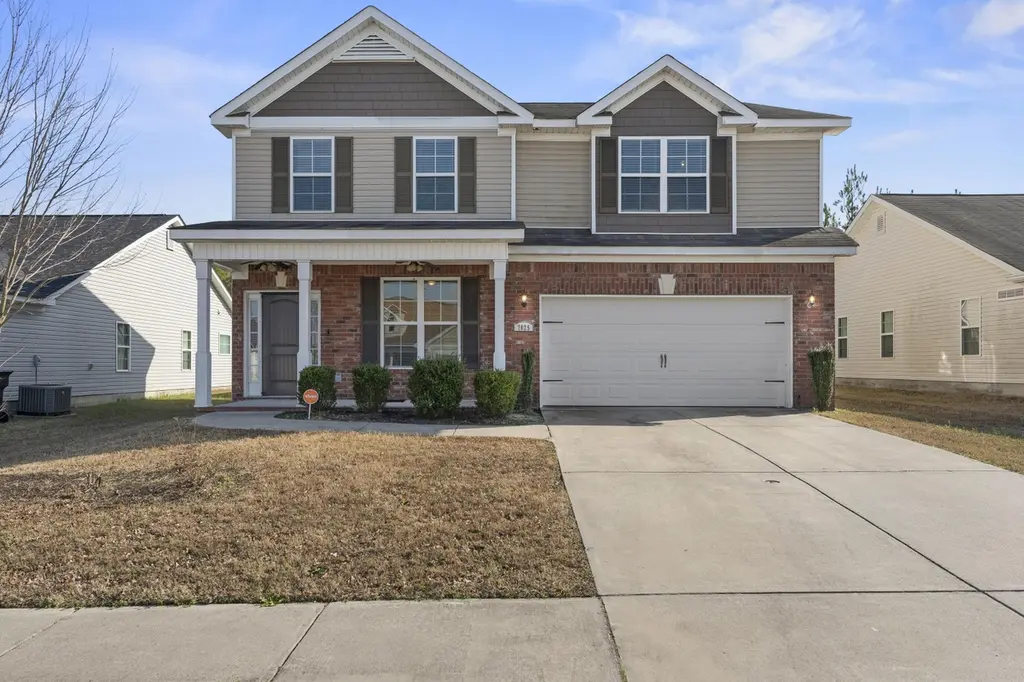
7025 Summerton Dr
Augusta-Richmond County consolidated government (balance), GA 30909
$317,000D-
4 bd · 2.5 ba ·
2,742 sqft ·
Built 2016
· SingleFamily
· Pending
Cashflow @ list (25.0% down · 7.5%)
Estimated rent
$2,628/mo
Mortgage (P&I)
−$1,662
Tax + insurance
−$456
HOA
−$28
Vac / Maint / Mgmt
−$552
Net cashflow
$-70/mo
Annual
$-838/yr
Cap rate
6.03%
Cash-on-cash
-0.94%
DSCR
0.96
1% rule
0.83%
Cash to close
$88,760
Investor read
- This is a 4-bed/2.5-bath single-family listed at $317k.
- At list price, monthly cash flow is $-70 ($-838/yr) — negative.
- To cash-flow at today's rent, offer at most $305k (3.9% below list).
- To meet the 1% rule (rent ≥ 1% of price), the offer needs to be $263k (17.1% below list).
- Only 0 days on market — expect competitive offers; lowballing is unlikely to land.
- Recommended offer: $263k (17.1% below list) — sets the bar for 1% rule.
- Local home prices are declining (-3.0%/yr); year-one equity from $2k of loan paydown is wiped out by about $10k of value loss. Plan a longer hold.
- Location reads: area grade D — affects rentability + tenant quality, not the cash-flow math above.
- Richmond County (urban): math 12% / reading 20% proficiency, ranked #154 of 174 in GA (top 88%) — low school quality limits family demand, transient renter base, plan for 1-2y turnover; 72% free/reduced lunch — lower-income household profile, screen leases tightly.
- Market conditions: Rents flat; 303 active listings in the ZIP; 11 comparable units currently listed for rent nearby; rentals at typical pace (median 24d on market — plan ~3-4 weeks tenant-placement turnaround); 561 units permitted in Richmond County in 2024 (0 in 5+ unit buildings).
- Richmond County population projected to shrink 5% by 2050 — rents likely to lag national; underwrite the cash flow, not the appreciation.
- 9 sale attempts since 10y ago with the ask held roughly flat each time — persistent listings suggest the price (not the market) is what's stuck; bring a comps-based counter.
- Current owner paid $213k; 49% above their basis — modest negotiation headroom, anchor on the comps not their cost.
- Climate carrying-cost: major wind risk, 66% chance of damaging wind over 30y; moderate wildfire risk; extreme-heat days projected 7→18/yr by 2055 (HVAC capex compounding) — expect insurance premiums to compound above CPI over the hold.
- This rent runs 44% of the median local income ($71k/yr) — at the standard rent-burdened threshold; future hikes will face affordability resistance.
Questions for listing agent
- What do current leases actually rent for vs. the listed asking? Can we see a recent rent roll and the last 12 months of T-12 income?
- What does the HOA fee cover, when was the last increase, and are there any pending special assessments or reserve-fund shortfalls?
- Is there a deadline driving the sale (1031 exchange, divorce, estate, relocation)? That informs how much negotiation room exists.
- The area grade is low — what's the realistic commute time and amenity access for the typical tenant pool here? Any planned neighborhood developments (good or bad) we should know about?
- What's the average days-on-market for RENTAL listings here right now (not sales)? A rising rental-DOM trend means longer vacancies and softer asking-rent achievability than the comps imply.
- What's the recent tenant-quality profile in this submarket — average credit score on applications, eviction rate, late-payment / NSF rate, and stable-employment percentage? A property-management company in the area should have these aggregated.
- How much new for-sale + rental construction is in the pipeline within 1–3 miles? Heavy new supply typically softens prices + rents 12–24 months out; constrained supply supports both.
CashFlowRE · CFR-DBXFGP5CMZ6J90
· Data 3 weeks ago
cashflowre.app · 2026-05-29