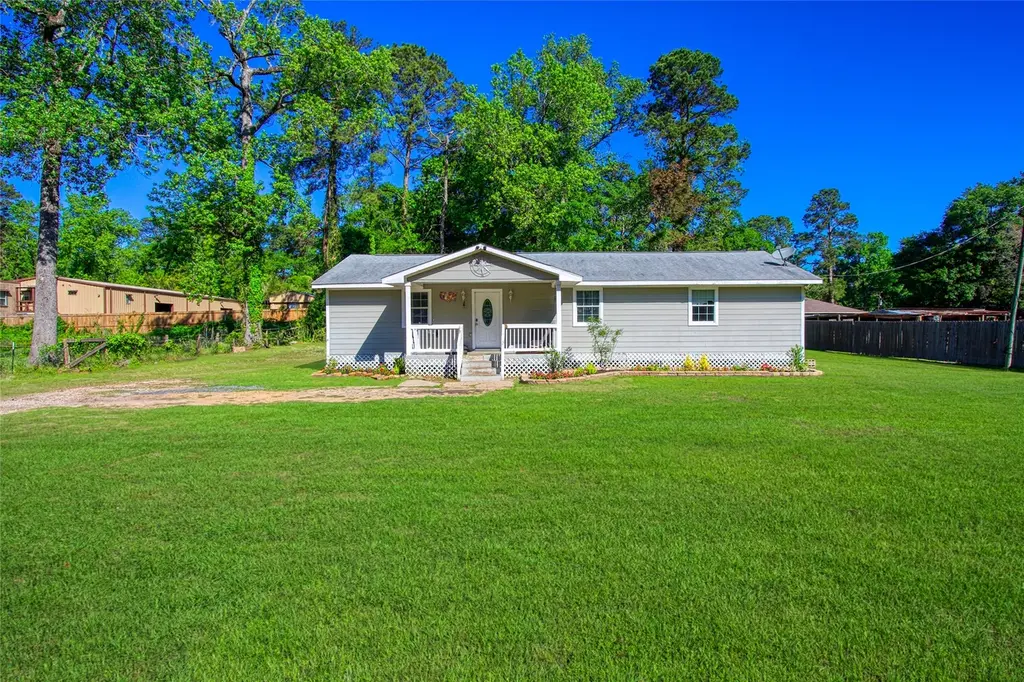
31111 Honeysuckle Ln
Pinehurst, TX 77354
$205,000C+
3 bd · 2.0 ba ·
1,712 sqft ·
Built 2017
· SingleFamily
· Active
· 69 DOM
Cashflow @ list (25.0% down · 7.5%)
Estimated rent
$2,058/mo
Mortgage (P&I)
−$1,075
Tax + insurance
−$822
HOA
−$0
Vac / Maint / Mgmt
−$432
Net cashflow
$-271/mo
Annual
$-3,257/yr
Cap rate
7.20%
Cash-on-cash
3.24%
DSCR
1.14
1% rule
1.00%
Cash to close
$57,400
Investor read
- This is a 3-bed/2.0-bath single-family listed at $205k.
- At list price, monthly cash flow is $-271 ($-3k/yr) — negative.
- To cash-flow at today's rent, offer at most $157k (23.4% below list).
- Meets the 1% rule at list price ($2k rent vs $205k).
- It's been on market 69 days — a 6% lower offer ($193k) is reasonable based on typical stale-listing flexibility.
- Recommended offer: $157k (23.4% below list) — sets the bar for cash-flow.
- In year one you build about $22k of equity ($1k loan paydown + $20k appreciation (10.0% local appreciation)).
- Location reads 55/100 on livability (#1,350 in TX) — a working-class tenant base; expect higher turnover. Strengths: cost of living A+, housing B+; Watch: employment C-, schools F, crime D-.
- Magnolia ISD (rural): math 42% / reading 45% proficiency, ranked #247 of 826 in TX (top 30%) — families likely to look elsewhere, expect single-tenant / working-renter base with shorter leases.
- Watch-outs: flood insurance adds $427/mo.
- Market conditions: Rents flat; 1604 active listings in the ZIP; 2 comparable units currently listed for rent nearby; high-income renter base; 13,259 units permitted in Montgomery County in 2024 (1,402 in 5+ unit buildings).
- Montgomery County population projected at +65% by 2050 — long-run rental-demand tailwind backs the buy-and-hold thesis.
- 8 sale attempts since 10y ago; this cycle's ask has dropped $30k (13%) from the opening price — seller is motivated, your offer sets the floor, not the list.
- By year 2, paydown + projected appreciation supports a ~$35k cash-out refi (75% LTV) — recoverable capital for the next deal without selling this one.
- Climate carrying-cost: in FEMA flood zone AE (mandatory federal flood insurance); severe wind risk, 99% chance of damaging wind over 30y; extreme-heat days projected 7→23/yr by 2055 (HVAC capex compounding) — expect insurance premiums to compound above CPI over the hold.
- Cap rate 7.2% vs local median 2.0% in Pinehurst — top-decile yield for the area; either an underpriced asset or a hidden risk that comps aren't pricing in. Stress-test before assuming the spread holds.
Questions for listing agent
- What do current leases actually rent for vs. the listed asking? Can we see a recent rent roll and the last 12 months of T-12 income?
- It's been on market 69 days. Have you received any prior offers? Is the seller open to a 23% concession, seller financing, or rate buy-down credit?
- What's the actual annual flood-insurance premium (NFIP or private), and is the property in a SFHA with mandatory coverage?
- Why hasn't it sold? Are there any deal-killer items the seller is aware of (foundation, flood, title, zoning, code violations)?
- Is there a deadline driving the sale (1031 exchange, divorce, estate, relocation)? That informs how much negotiation room exists.
- Schools are F-rated, which usually means shorter tenancies and higher turnover. Who's the typical renter profile here, and what's been the actual vacancy rate?
- Crime grade is D in this area — have there been break-ins, vandalism, or insurance claims at this property in the last 3 years? What carrier currently insures it and at what premium?
- What's the average days-on-market for RENTAL listings here right now (not sales)? A rising rental-DOM trend means longer vacancies and softer asking-rent achievability than the comps imply.
CashFlowRE · CFR-DC6DXJCJS439JT
· Data 2 days ago
cashflowre.app · 2026-05-29