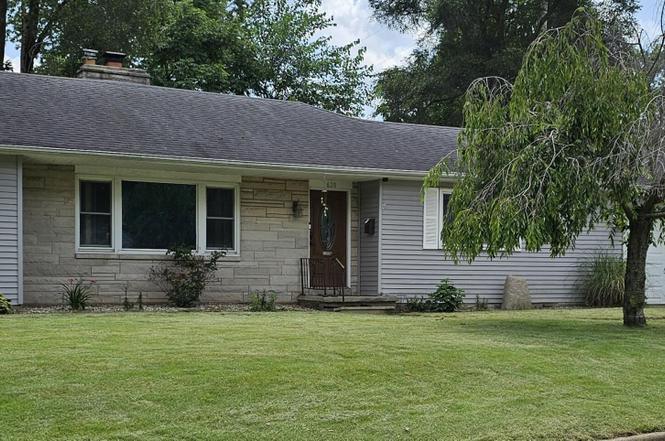
620 Meadow Dr
Battle Creek, MI 49015
$189,900C
4 bd · 1.5 ba ·
1,525 sqft ·
Built 1954
· SingleFamily
· Pending
· 394 DOM
Cashflow @ list (25.0% down · 7.5%)
Estimated rent
$1,803/mo
Mortgage (P&I)
−$996
Tax + insurance
−$295
HOA
−$0
Vac / Maint / Mgmt
−$379
Net cashflow
$134/mo
Annual
$1,608/yr
Cap rate
7.14%
Cash-on-cash
3.02%
DSCR
1.13
1% rule
0.95%
Cash to close
$53,172
Investor read
- This is a 4-bed/1.5-bath single-family listed at $190k.
- At list price, monthly cash flow is $134 ($2k/yr) — positive.
- The deal already cash-flows at list — no discount required.
- To meet the 1% rule (rent ≥ 1% of price), the offer needs to be $180k (5.0% below list).
- It's been on market 394 days — a 12% lower offer ($167k) is reasonable based on typical stale-listing flexibility.
- Recommended offer: $167k (12.0% below list) — sets the bar for market timing.
- Local home prices are declining (-3.0%/yr); year-one equity from $1k of loan paydown is wiped out by about $6k of value loss. Plan a longer hold.
- Location reads 73/100 on livability (#198 in MI) — a middle-class / working-renter tenant base. Strengths: cost of living A+, housing A+, health & safety A+; Watch: schools C-, amenities C-, crime F.
- Lakeview School District (Calhoun) (urban): math 28% / reading 40% proficiency, ranked #291 of 540 in MI (top 54%) — families likely to look elsewhere, expect single-tenant / working-renter base with shorter leases.
- Watch-outs: built in 1954 — expect roof / HVAC / electrical / plumbing capex.
- Market conditions: Rents rising fast (+11.1%/yr); 165 active listings in the ZIP; 132 units permitted in Calhoun County in 2024 (0 in 5+ unit buildings).
- Calhoun County population projected at -16% by 2050 — secular population decline; favor cash flow + early exit over multi-decade hold.
- 5 sale attempts since 2y ago; this cycle's ask has dropped $60k (24%) from the opening price — seller is motivated, your offer sets the floor, not the list.
- At projected returns (-3.0% appreciation + 8.0% rent growth), your $53k cash investment doubles in ~10 years — after that, you're playing with house money.
- Cap rate 7.1% vs local median 5.2% in Battle Creek — top-decile yield for the area; either an underpriced asset or a hidden risk that comps aren't pricing in. Stress-test before assuming the spread holds.
- This rent runs 31% of the median local income ($69k/yr) — at the standard rent-burdened threshold; future hikes will face affordability resistance.
Questions for listing agent
- It's been on market 394 days. Have you received any prior offers? Is the seller open to a 12% concession, seller financing, or rate buy-down credit?
- Built in 1954 — when were the roof, HVAC, electrical panel, plumbing, and water heater last replaced?
- Why hasn't it sold? Are there any deal-killer items the seller is aware of (foundation, flood, title, zoning, code violations)?
- Is there a deadline driving the sale (1031 exchange, divorce, estate, relocation)? That informs how much negotiation room exists.
- Crime grade is F in this area — have there been break-ins, vandalism, or insurance claims at this property in the last 3 years? What carrier currently insures it and at what premium?
- What's the average days-on-market for RENTAL listings here right now (not sales)? A rising rental-DOM trend means longer vacancies and softer asking-rent achievability than the comps imply.
- What's the recent tenant-quality profile in this submarket — average credit score on applications, eviction rate, late-payment / NSF rate, and stable-employment percentage? A property-management company in the area should have these aggregated.
- How much new for-sale + rental construction is in the pipeline within 1–3 miles? Heavy new supply typically softens prices + rents 12–24 months out; constrained supply supports both.
CashFlowRE · CFR-DD3C8SC3D7B3W7
· Data 3 weeks ago
cashflowre.app · 2026-05-29