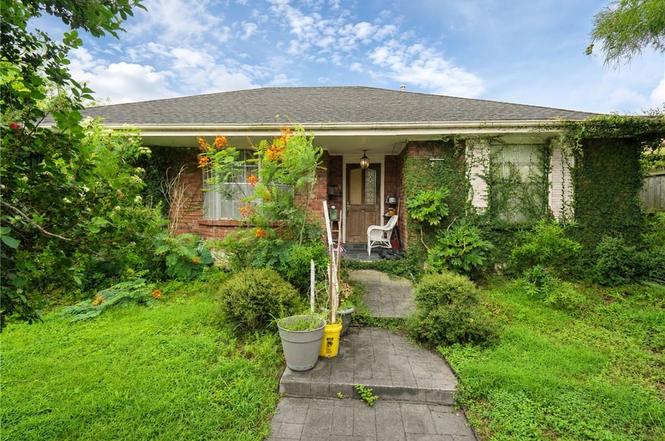
29 Forstall Ave
Kenner, LA 70065
$200,000C+
3 bd · 2.0 ba ·
1,991 sqft ·
Built 1973
· SingleFamily
· Active
· 1 DOM
Cashflow @ list (25.0% down · 7.5%)
Estimated rent
$2,154/mo
Mortgage (P&I)
−$1,049
Tax + insurance
−$285
HOA
−$0
Vac / Maint / Mgmt
−$452
Net cashflow
$368/mo
Annual
$4,416/yr
Cap rate
8.90%
Cash-on-cash
9.31%
DSCR
1.41
1% rule
1.08%
Cash to close
$56,000
Investor read
- This is a 3-bed/2.0-bath single-family listed at $200k.
- At list price, monthly cash flow is $368 ($4k/yr) — positive.
- The deal already cash-flows at list — no discount required.
- Meets the 1% rule at list price ($2k rent vs $200k).
- Only 1 days on market — expect competitive offers; lowballing is unlikely to land.
- Local home prices are declining (-3.0%/yr); year-one equity from $1k of loan paydown is wiped out by about $6k of value loss. Plan a longer hold.
- Location reads 78/100 on livability (#6 in LA, #2,414 nationally) — a middle-class / working-renter tenant base. Strengths: cost of living A+, housing A+, health & safety A+; Watch: amenities C-, employment C-, crime D.
- Jefferson Parish (suburban): math 24% / reading 34% proficiency, ranked #44 of 98 in LA (top 45%) — low school quality limits family demand, transient renter base, plan for 1-2y turnover; 70% free/reduced lunch — lower-income household profile, screen leases tightly.
- Watch-outs: flood insurance adds $66/mo.
- Market conditions: Rents falling (-4.2%/yr); 292 active listings in the ZIP; 36 comparable units currently listed for rent nearby; rentals at typical pace (median 24d on market — plan ~3-4 weeks tenant-placement turnaround); 518 units permitted in Jefferson Parish in 2024 (43 in 5+ unit buildings).
- 2 sale attempts with the ask held roughly flat each time — persistent listings suggest the price (not the market) is what's stuck; bring a comps-based counter.
- Current owner paid $135k; 48% above their basis — modest negotiation headroom, anchor on the comps not their cost.
- Climate carrying-cost: severe flood risk; severe wind risk, 99% chance of damaging wind over 30y; extreme-heat days projected 7→21/yr by 2055 (HVAC capex compounding) — expect insurance premiums to compound above CPI over the hold.
- Cap rate 8.9% vs local median 5.3% in Kenner — top-decile yield for the area; either an underpriced asset or a hidden risk that comps aren't pricing in. Stress-test before assuming the spread holds.
- This rent runs 38% of the median local income ($67k/yr) — at the standard rent-burdened threshold; future hikes will face affordability resistance.
Questions for listing agent
- Built in 1973 — when were the roof, HVAC, electrical panel, plumbing, and water heater last replaced?
- What's the actual annual flood-insurance premium (NFIP or private), and is the property in a SFHA with mandatory coverage?
- Is there a deadline driving the sale (1031 exchange, divorce, estate, relocation)? That informs how much negotiation room exists.
- Crime grade is D in this area — have there been break-ins, vandalism, or insurance claims at this property in the last 3 years? What carrier currently insures it and at what premium?
- This sits on a lake — are riparian / water-frontage rights deeded with the parcel? Any dock permits, shoreline easements, or HOA water-use restrictions?
- What's the documented flood / surge / shoreline-erosion history here (FEMA AND non-FEMA — e.g., storm surge, creek backup, septic-field saturation)?
- Any water-quality or seasonal algae-bloom issues that affect tenant satisfaction or short-term-rental demand?
- What's the average days-on-market for RENTAL listings here right now (not sales)? A rising rental-DOM trend means longer vacancies and softer asking-rent achievability than the comps imply.
CashFlowRE · CFR-DDKBKA4ZZT02YX
· Data 2 days ago
cashflowre.app · 2026-05-29