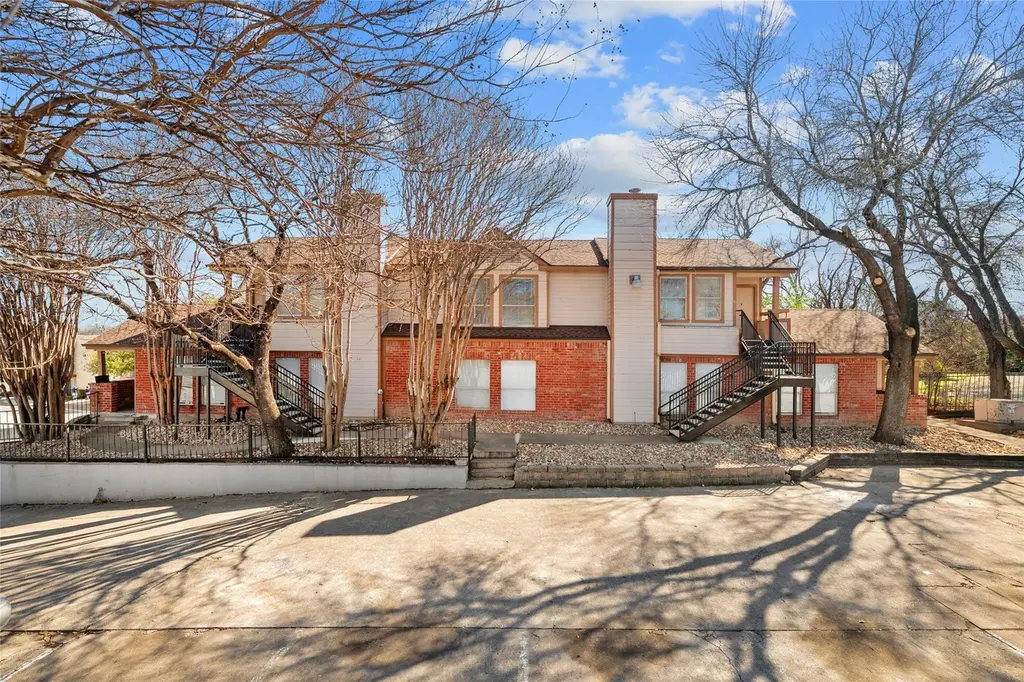
7111 E Highway 290 E
Austin, TX 78723
$750,000F
24 bd · 26.0 ba ·
3,884 sqft ·
Built 1984
· MultiFamily
· Active
· 129 DOM
Cashflow @ list (25.0% down · 7.5%)
Estimated rent
$5,258/mo
Mortgage (P&I)
−$3,933
Tax + insurance
−$1,250
HOA
−$0
Vac / Maint / Mgmt
−$1,104
Net cashflow
$-1,029/mo
Annual
$-12,351/yr
Cap rate
4.65%
Cash-on-cash
-5.88%
DSCR
0.74
1% rule
0.70%
Cash to close
$210,000
Investor read
- This is a 2×2bd/1.5ba + 2×1bd/1ba units multifamily listed at $750k. Condition is rated good.
- At list price, monthly cash flow is $-1k ($-12k/yr) — negative. Per door: $-257/mo.
- To cash-flow at today's rent, offer at most $601k (19.9% below list).
- To meet the 1% rule (rent ≥ 1% of price), the offer needs to be $526k (29.9% below list).
- It's been on market 129 days — a 12% lower offer ($660k) is reasonable based on typical stale-listing flexibility.
- Recommended offer: $526k (29.9% below list) — sets the bar for 1% rule.
- Local home prices are declining (-3.0%/yr); year-one equity from $5k of loan paydown is wiped out by about $22k of value loss. Plan a longer hold.
- Location reads 82/100 on livability (#16 in TX, #1,208 nationally) — a professional / high-income tenant draw. Strengths: amenities A+, commute A+, employment A+; Watch: cost of living D, crime F.
- Austin ISD (urban): math 33% / reading 44% proficiency, ranked #431 of 826 in TX (top 52%) — families likely to look elsewhere, expect single-tenant / working-renter base with shorter leases.
- Market conditions: Rents soft (-1.0%/yr); 361 active listings in the ZIP; 1 comparable units currently listed for rent nearby; solid renter incomes; 17,121 units permitted in Travis County in 2024 (11,963 in 5+ unit buildings).
- Travis County population projected at +60% by 2050 — long-run rental-demand tailwind backs the buy-and-hold thesis.
- 7 sale attempts with the ask held roughly flat each time — persistent listings suggest the price (not the market) is what's stuck; bring a comps-based counter.
- Climate carrying-cost: severe wind risk, 80% chance of damaging wind over 30y; extreme-heat days projected 7→22/yr by 2055 (HVAC capex compounding) — expect insurance premiums to compound above CPI over the hold.
- Cap rate 4.6% vs local median 1.8% in Austin — top-decile yield for the area; either an underpriced asset or a hidden risk that comps aren't pricing in. Stress-test before assuming the spread holds.
- This rent per unit is only 16% of the median local income ($100k/yr) — well below the 30% rent-burden line; pricing power to push rent on renewal without tenant pushback.
Questions for listing agent
- What do current leases actually rent for vs. the listed asking? Can we see a recent rent roll and the last 12 months of T-12 income?
- It's been on market 129 days. Have you received any prior offers? Is the seller open to a 30% concession, seller financing, or rate buy-down credit?
- Can we see the unit-by-unit rent roll, current vacancy, and any below-market leases? What's the average tenancy length?
- What capital expenditures (roof, boiler, parking lot, exteriors) have been made in the last 5 years, and what's planned in the next 2?
- Why hasn't it sold? Are there any deal-killer items the seller is aware of (foundation, flood, title, zoning, code violations)?
- Is there a deadline driving the sale (1031 exchange, divorce, estate, relocation)? That informs how much negotiation room exists.
- Crime grade is F in this area — have there been break-ins, vandalism, or insurance claims at this property in the last 3 years? What carrier currently insures it and at what premium?
- The area grade is low — what's the realistic commute time and amenity access for the typical tenant pool here? Any planned neighborhood developments (good or bad) we should know about?
CashFlowRE · CFR-DFS0TA1E852PX6
· Data 3 h ago
cashflowre.app · 2026-05-29