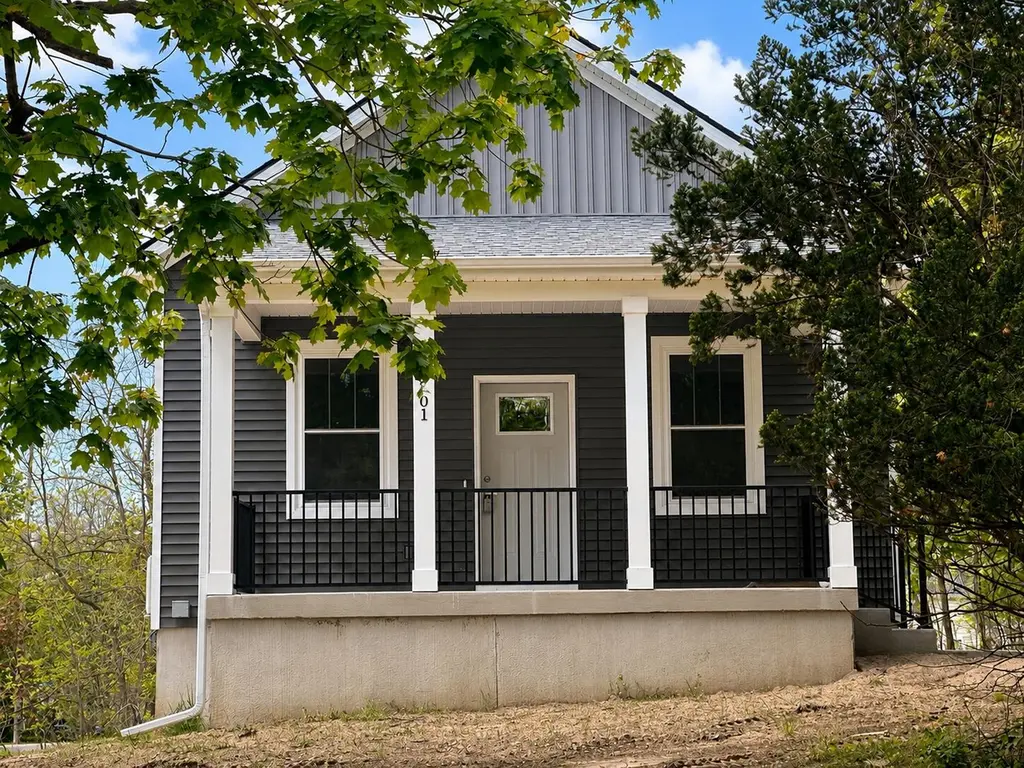
501 Fenimore Ave
Eastwood, MI 49048
$204,000F
4 bd · 2.0 ba ·
1,296 sqft ·
Built 2025
· SingleFamily
· Pending
· 22 DOM
Cashflow @ list (25.0% down · 7.5%)
Estimated rent
$1,702/mo
Mortgage (P&I)
−$1,070
Tax + insurance
−$340
HOA
−$0
Vac / Maint / Mgmt
−$357
Net cashflow
$-65/mo
Annual
$-783/yr
Cap rate
5.91%
Cash-on-cash
-1.37%
DSCR
0.94
1% rule
0.83%
Cash to close
$57,120
Investor read
- This is a 4-bed/2.0-bath single-family listed at $204k.
- At list price, monthly cash flow is $-65 ($-783/yr) — negative.
- To cash-flow at today's rent, offer at most $195k (4.6% below list).
- To meet the 1% rule (rent ≥ 1% of price), the offer needs to be $170k (16.6% below list).
- It's been on market 22 days — a 2% lower offer ($201k) is reasonable based on typical stale-listing flexibility.
- Recommended offer: $170k (16.6% below list) — sets the bar for 1% rule.
- Local home prices are declining (-3.0%/yr); year-one equity from $1k of loan paydown is wiped out by about $6k of value loss. Plan a longer hold.
- Location reads 74/100 on livability (#187 in MI, #4,713 nationally) — a middle-class / working-renter tenant base. Strengths: cost of living A+, housing A+, health & safety A+; Watch: crime C-, employment D+, amenities F.
- Kalamazoo Public Schools (urban): math 43% / reading 72% proficiency, ranked #71 of 540 in MI (top 13%) — acceptable for families but not a draw, mixed tenant base, ~2y average lease; 66% free/reduced lunch — lower-income household profile, screen leases tightly.
- Zoned schools: Northeastern Elementary School (212 students, 92% FRL); Linden Grove Middle School (math 30% / reading 70%, grade C, #125 of 493 statewide, top 25%, 705 students, 69% FRL); Kalamazoo Central High School (math 42% / reading 67%, grade C-, #109 of 713 statewide, top 17%, 1,612 students, 64% FRL).
- Market conditions: Rents rising fast (+7.9%/yr); 156 active listings in the ZIP; 1 comparable units currently listed for rent nearby; 339 units permitted in Kalamazoo County in 2024 (22 in 5+ unit buildings).
- Kalamazoo County population projected at +18% by 2050 — long-run rental-demand tailwind backs the buy-and-hold thesis.
- 5 sale attempts with the ask held roughly flat each time — persistent listings suggest the price (not the market) is what's stuck; bring a comps-based counter.
- This rent runs 34% of the median local income ($60k/yr) — at the standard rent-burdened threshold; future hikes will face affordability resistance.
Questions for listing agent
- What do current leases actually rent for vs. the listed asking? Can we see a recent rent roll and the last 12 months of T-12 income?
- Is there a deadline driving the sale (1031 exchange, divorce, estate, relocation)? That informs how much negotiation room exists.
- The area grade is low — what's the realistic commute time and amenity access for the typical tenant pool here? Any planned neighborhood developments (good or bad) we should know about?
- What's the average days-on-market for RENTAL listings here right now (not sales)? A rising rental-DOM trend means longer vacancies and softer asking-rent achievability than the comps imply.
- What's the recent tenant-quality profile in this submarket — average credit score on applications, eviction rate, late-payment / NSF rate, and stable-employment percentage? A property-management company in the area should have these aggregated.
- How much new for-sale + rental construction is in the pipeline within 1–3 miles? Heavy new supply typically softens prices + rents 12–24 months out; constrained supply supports both.
CashFlowRE · CFR-DM5PAREQ7M7WDK
· Data 3 weeks ago
cashflowre.app · 2026-05-29