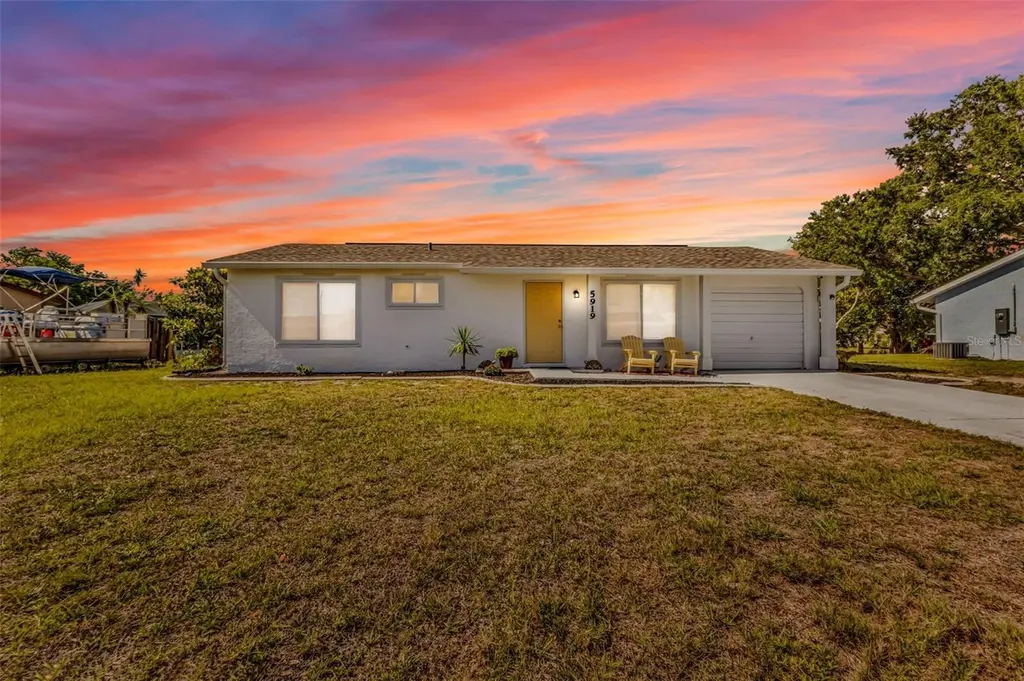
5919 Hobhill Ave
North Port, FL 34287
$205,000C-
3 bd · 1.5 ba ·
864 sqft ·
Built 1983
· SingleFamily
· Active
· 63 DOM
Cashflow @ list (25.0% down · 7.5%)
Estimated rent
$1,820/mo
Mortgage (P&I)
−$1,075
Tax + insurance
−$396
HOA
−$0
Vac / Maint / Mgmt
−$382
Net cashflow
$-33/mo
Annual
$-398/yr
Cap rate
6.49%
Cash-on-cash
0.70%
DSCR
1.03
1% rule
0.89%
Cash to close
$57,400
Investor read
- This is a 3-bed/1.5-bath single-family listed at $205k.
- At list price, monthly cash flow is $-33 ($-398/yr) — negative.
- To cash-flow at today's rent, offer at most $199k (2.9% below list).
- To meet the 1% rule (rent ≥ 1% of price), the offer needs to be $182k (11.2% below list).
- It's been on market 63 days — a 6% lower offer ($193k) is reasonable based on typical stale-listing flexibility.
- Recommended offer: $182k (11.2% below list) — sets the bar for 1% rule.
- Local home prices are declining (-3.0%/yr); year-one equity from $1k of loan paydown is wiped out by about $6k of value loss. Plan a longer hold.
- Location reads 75/100 on livability (#252 in FL, #3,975 nationally) — a middle-class / working-renter tenant base. Strengths: crime A+, housing A+, health & safety A+; Watch: amenities F, commute F.
- Sarasota (urban): math 63% / reading 63% proficiency, ranked #7 of 73 in FL (top 10%) — acceptable for families but not a draw, mixed tenant base, ~2y average lease.
- Watch-outs: flood insurance adds $66/mo.
- Market conditions: Rents flat; 852 active listings in the ZIP; 1 comparable units currently listed for rent nearby; 7,466 units permitted in Sarasota County in 2024 (2,138 in 5+ unit buildings).
- Sarasota County population projected at +20% by 2050 — long-run rental-demand tailwind backs the buy-and-hold thesis.
- 4 sale attempts since 16y ago; this cycle's ask has dropped $17k (8%) from the opening price — seller is motivated, your offer sets the floor, not the list.
- Current owner paid $169k; 21% above their basis — modest negotiation headroom, anchor on the comps not their cost.
- Climate carrying-cost: major flood risk; severe wind risk, 99% chance of damaging wind over 30y; extreme-heat days projected 7→28/yr by 2055 (HVAC capex compounding) — expect insurance premiums to compound above CPI over the hold.
- Cap rate 6.5% vs local median 3.6% in North Port — top-decile yield for the area; either an underpriced asset or a hidden risk that comps aren't pricing in. Stress-test before assuming the spread holds.
- This rent runs 34% of the median local income ($63k/yr) — at the standard rent-burdened threshold; future hikes will face affordability resistance.
Questions for listing agent
- What do current leases actually rent for vs. the listed asking? Can we see a recent rent roll and the last 12 months of T-12 income?
- It's been on market 63 days. Have you received any prior offers? Is the seller open to a 11% concession, seller financing, or rate buy-down credit?
- What's the actual annual flood-insurance premium (NFIP or private), and is the property in a SFHA with mandatory coverage?
- Why hasn't it sold? Are there any deal-killer items the seller is aware of (foundation, flood, title, zoning, code violations)?
- Is there a deadline driving the sale (1031 exchange, divorce, estate, relocation)? That informs how much negotiation room exists.
- Schools are B-rated — typically a magnet for longer-tenancy family renters. What's the average tenant stay here, and is there a school-zone premium baked into asking?
- What's the average days-on-market for RENTAL listings here right now (not sales)? A rising rental-DOM trend means longer vacancies and softer asking-rent achievability than the comps imply.
- What's the recent tenant-quality profile in this submarket — average credit score on applications, eviction rate, late-payment / NSF rate, and stable-employment percentage? A property-management company in the area should have these aggregated.
CashFlowRE · CFR-DMWTC0FEBVBPWX
· Data 2 days ago
cashflowre.app · 2026-05-29