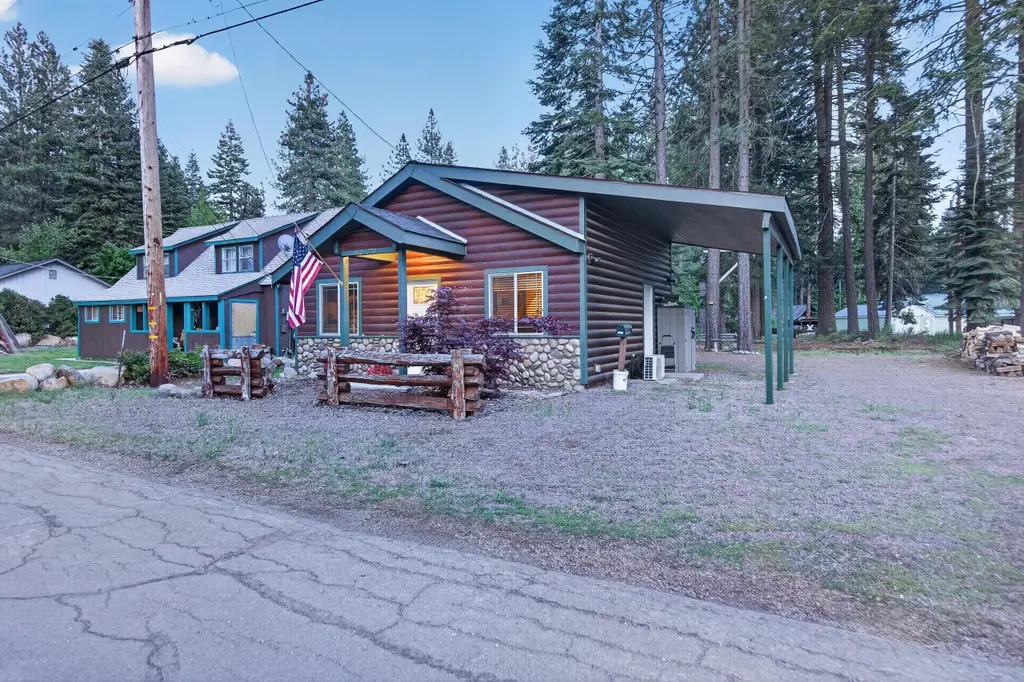
462-770 - Rainbow Dr
Clear Creek, CA 96137
$184,900D
1 bd · 1.0 ba ·
528 sqft ·
Built 2017
· SingleFamily
· Pending
· 28 DOM
Cashflow @ list (25.0% down · 7.5%)
Estimated rent
$1,446/mo
Mortgage (P&I)
−$970
Tax + insurance
−$231
HOA
−$0
Vac / Maint / Mgmt
−$304
Net cashflow
$-58/mo
Annual
$-695/yr
Cap rate
5.92%
Cash-on-cash
-1.34%
DSCR
0.94
1% rule
0.78%
Cash to close
$51,772
Investor read
- This is a 1-bed/1.0-bath single-family listed at $185k.
- At list price, monthly cash flow is $-58 ($-695/yr) — negative.
- To cash-flow at today's rent, offer at most $175k (5.5% below list).
- To meet the 1% rule (rent ≥ 1% of price), the offer needs to be $145k (21.8% below list).
- It's been on market 28 days — a 2% lower offer ($182k) is reasonable based on typical stale-listing flexibility.
- Recommended offer: $145k (21.8% below list) — sets the bar for 1% rule.
- In year one you build about $4k of equity ($1k loan paydown + $3k appreciation (1.4% local appreciation)).
- Location reads 51/100 on livability (#1,096 in CA) — a working-class tenant base; expect higher turnover. Strengths: housing A-; Watch: employment D+, cost of living D+, crime F.
- Westwood Unified (rural): math 30% / reading 35% proficiency, ranked #995 of 1,400 in CA (top 71%) — families likely to look elsewhere, expect single-tenant / working-renter base with shorter leases.
- Zoned schools: Fletcher Walker Elementary (math 5% / reading 24%, grade F, #1,420 of 1,571 statewide, top 91%, 89 students, 80% FRL); Westwood High (math 15% / reading 44%, grade F, #723 of 1,170 statewide, top 64%, 85 students, 69% FRL) — zoned schools average 75% FRL vs 53% district-wide (21 pts higher); higher-poverty schools than district average — tighter screening recommended.
- Market conditions: 240 active listings in the ZIP; 6 units permitted in Lassen County in 2024 (0 in 5+ unit buildings).
- Lassen County population projected at -14% by 2050 — secular population decline; favor cash flow + early exit over multi-decade hold.
- 3 sale attempts since 12y ago with the ask held roughly flat each time — persistent listings suggest the price (not the market) is what's stuck; bring a comps-based counter.
- At projected returns (1.4% appreciation + 3.0% rent growth), your $52k cash investment doubles in ~10 years — after that, you're playing with house money.
- By year 9, paydown + projected appreciation supports a ~$34k cash-out refi (75% LTV) — recoverable capital for the next deal without selling this one.
- Climate carrying-cost: moderate flood risk; major wildfire risk — expect insurance premiums to compound above CPI over the hold.
Questions for listing agent
- What do current leases actually rent for vs. the listed asking? Can we see a recent rent roll and the last 12 months of T-12 income?
- Is there a deadline driving the sale (1031 exchange, divorce, estate, relocation)? That informs how much negotiation room exists.
- Crime grade is F in this area — have there been break-ins, vandalism, or insurance claims at this property in the last 3 years? What carrier currently insures it and at what premium?
- The area grade is low — what's the realistic commute time and amenity access for the typical tenant pool here? Any planned neighborhood developments (good or bad) we should know about?
- What's the average days-on-market for RENTAL listings here right now (not sales)? A rising rental-DOM trend means longer vacancies and softer asking-rent achievability than the comps imply.
- What's the recent tenant-quality profile in this submarket — average credit score on applications, eviction rate, late-payment / NSF rate, and stable-employment percentage? A property-management company in the area should have these aggregated.
- How much new for-sale + rental construction is in the pipeline within 1–3 miles? Heavy new supply typically softens prices + rents 12–24 months out; constrained supply supports both.
CashFlowRE · CFR-DMZAKK7ZB0N1CB
· Data 16 h ago
cashflowre.app · 2026-05-29