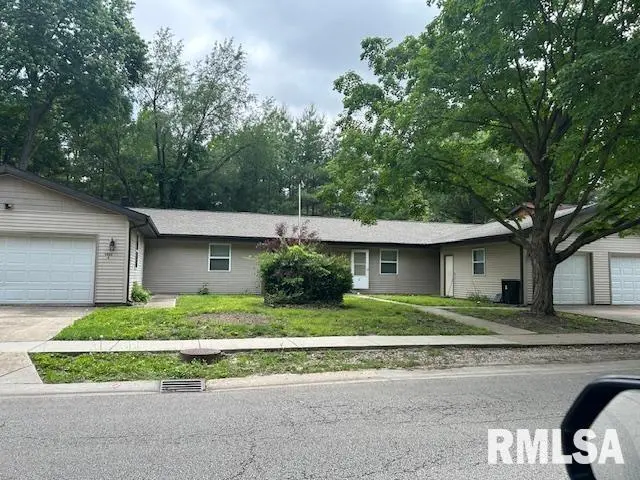
1400 Shiloh Dr Unit A , B, C
Springfield, IL 62704-7129
$275,000C
6 bd · 5.6 ba ·
3,283 sqft ·
Built 1979
· MultiFamily
· Pending
· 7 DOM
Cashflow @ list (25.0% down · 7.5%)
Estimated rent
$2,890/mo
Mortgage (P&I)
−$1,442
Tax + insurance
−$458
HOA
−$0
Vac / Maint / Mgmt
−$607
Net cashflow
$383/mo
Annual
$4,592/yr
Cap rate
7.96%
Cash-on-cash
5.96%
DSCR
1.27
1% rule
1.05%
Cash to close
$77,000
Investor read
- This is a 2 × 3-bed/2.8-bath units multifamily listed at $275k. Condition is rated good.
- At list price, monthly cash flow is $383 ($5k/yr) — positive. Per door: $191/mo.
- The deal already cash-flows at list — no discount required.
- Meets the 1% rule at list price ($3k rent vs $275k).
- Only 7 days on market — expect competitive offers; lowballing is unlikely to land.
- In year one you build about $10k of equity ($2k loan paydown + $8k appreciation (3.0% local appreciation)).
- Location reads 79/100 on livability (#122 in IL, #2,138 nationally) — a middle-class / working-renter tenant base. Strengths: amenities A+, commute A+, cost of living A+; Watch: crime F.
- Springfield SD 186 (urban): math 17% / reading 22% proficiency, ranked #438 of 620 in IL (top 71%) — low school quality limits family demand, transient renter base, plan for 1-2y turnover; 64% free/reduced lunch — lower-income household profile, screen leases tightly.
- Zoned schools: Southern View Elem School (math 5% / reading 5%, grade F, #1,741 of 2,056 statewide, top 93%, 140 students, 0% FRL); Jefferson Middle School (math 3% / reading 8%, grade F, #635 of 665 statewide, top 95%, 539 students, 0% FRL); Springfield Southeast High Sch (math 17% / reading 22%, grade F, #397 of 693 statewide, top 61%, 1,261 students, 0% FRL) — zoned schools average 0% FRL vs 64% district-wide (64 pts lower); this property's tenant base skews higher-income than the district average.
- Market conditions: 1 active listings in the ZIP; 225 units permitted in Sangamon County in 2024 (48 in 5+ unit buildings).
- Sangamon County population projected to shrink 9% by 2050 — rents likely to lag national; underwrite the cash flow, not the appreciation.
- At projected returns (3.0% appreciation + 3.0% rent growth), your $77k cash investment doubles in ~5 years — after that, you're playing with house money.
- By year 4, paydown + projected appreciation supports a ~$34k cash-out refi (75% LTV) — recoverable capital for the next deal without selling this one.
- Cap rate 8.0% vs local median 4.9% in Springfield — top-decile yield for the area; either an underpriced asset or a hidden risk that comps aren't pricing in. Stress-test before assuming the spread holds.
Questions for listing agent
- Can we see the unit-by-unit rent roll, current vacancy, and any below-market leases? What's the average tenancy length?
- What capital expenditures (roof, boiler, parking lot, exteriors) have been made in the last 5 years, and what's planned in the next 2?
- Built in 1979 — when were the roof, HVAC, electrical panel, plumbing, and water heater last replaced?
- Is there a deadline driving the sale (1031 exchange, divorce, estate, relocation)? That informs how much negotiation room exists.
- Schools are D-rated, which usually means shorter tenancies and higher turnover. Who's the typical renter profile here, and what's been the actual vacancy rate?
- Crime grade is F in this area — have there been break-ins, vandalism, or insurance claims at this property in the last 3 years? What carrier currently insures it and at what premium?
- What's the average days-on-market for RENTAL listings here right now (not sales)? A rising rental-DOM trend means longer vacancies and softer asking-rent achievability than the comps imply.
- What's the recent tenant-quality profile in this submarket — average credit score on applications, eviction rate, late-payment / NSF rate, and stable-employment percentage? A property-management company in the area should have these aggregated.
CashFlowRE · CFR-DN9S290T3C0M01
· Data 2 weeks ago
cashflowre.app · 2026-05-29