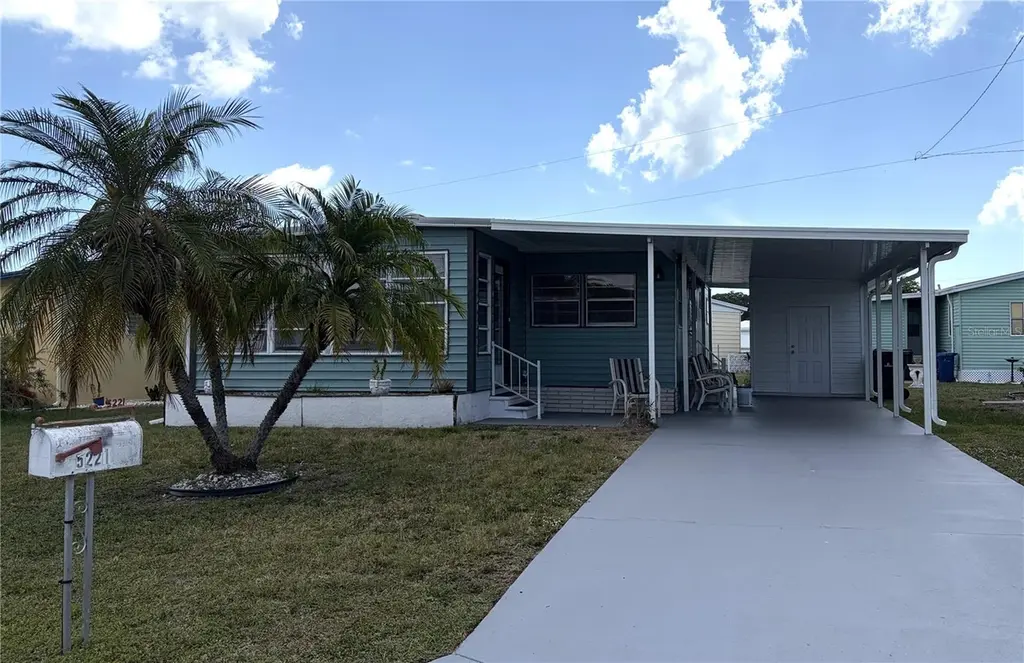
5221 Beechmont Ave
Desoto Acres, FL 34234
$159,500B-
2 bd · 1.5 ba ·
864 sqft ·
Built 1973
· Manufactured
· Active
· 27 DOM
Cashflow @ list (25.0% down · 7.5%)
Estimated rent
$2,289/mo
Mortgage (P&I)
−$836
Tax + insurance
−$330
HOA
−$137
Vac / Maint / Mgmt
−$481
Net cashflow
$505/mo
Annual
$6,055/yr
Cap rate
10.09%
Cash-on-cash
13.56%
DSCR
1.60
1% rule
1.44%
Cash to close
$44,660
Investor read
- This is a 2-bed/1.5-bath manufactured listed at $160k.
- At list price, monthly cash flow is $505 ($6k/yr) — positive.
- The deal already cash-flows at list — no discount required.
- Meets the 1% rule at list price ($2k rent vs $160k).
- It's been on market 27 days — a 2% lower offer ($157k) is reasonable based on typical stale-listing flexibility.
- Recommended offer: $157k (1.5% below list) — sets the bar for market timing.
- Local home prices are declining (-3.0%/yr); year-one equity from $1k of loan paydown is wiped out by about $5k of value loss. Plan a longer hold.
- Location reads: area grade B — affects rentability + tenant quality, not the cash-flow math above.
- Sarasota (urban): math 63% / reading 63% proficiency, ranked #7 of 73 in FL (top 10%) — acceptable for families but not a draw, mixed tenant base, ~2y average lease.
- Market conditions: Rents falling (-3.1%/yr); 268 active listings in the ZIP; 7 comparable units currently listed for rent nearby; rentals leasing fast (median 2d on market — plan ~1-2 weeks tenant-placement turnaround); 7,466 units permitted in Sarasota County in 2024 (2,138 in 5+ unit buildings).
- Sarasota County population projected at +20% by 2050 — long-run rental-demand tailwind backs the buy-and-hold thesis.
- Climate carrying-cost: severe wind risk, 99% chance of damaging wind over 30y; extreme-heat days projected 7→26/yr by 2055 (HVAC capex compounding) — expect insurance premiums to compound above CPI over the hold.
- Cap rate 10.1% vs local median 4.0% in Desoto Acres — top-decile yield for the area; either an underpriced asset or a hidden risk that comps aren't pricing in. Stress-test before assuming the spread holds.
- At $2,289/mo this rent would consume 48% of the median local household income ($57k/yr) (locally 1306% of renters already pay >50% of income on rent) — very limited rent-growth headroom before tenants either downsize or default.
Questions for listing agent
- Built in 1973 — when were the roof, HVAC, electrical panel, plumbing, and water heater last replaced?
- What does the HOA fee cover, when was the last increase, and are there any pending special assessments or reserve-fund shortfalls?
- Is there a deadline driving the sale (1031 exchange, divorce, estate, relocation)? That informs how much negotiation room exists.
- What's the average days-on-market for RENTAL listings here right now (not sales)? A rising rental-DOM trend means longer vacancies and softer asking-rent achievability than the comps imply.
- What's the recent tenant-quality profile in this submarket — average credit score on applications, eviction rate, late-payment / NSF rate, and stable-employment percentage? A property-management company in the area should have these aggregated.
- How much new for-sale + rental construction is in the pipeline within 1–3 miles? Heavy new supply typically softens prices + rents 12–24 months out; constrained supply supports both.
CashFlowRE · CFR-DSZGSB5957EWBG
· Data 2 days ago
cashflowre.app · 2026-05-29