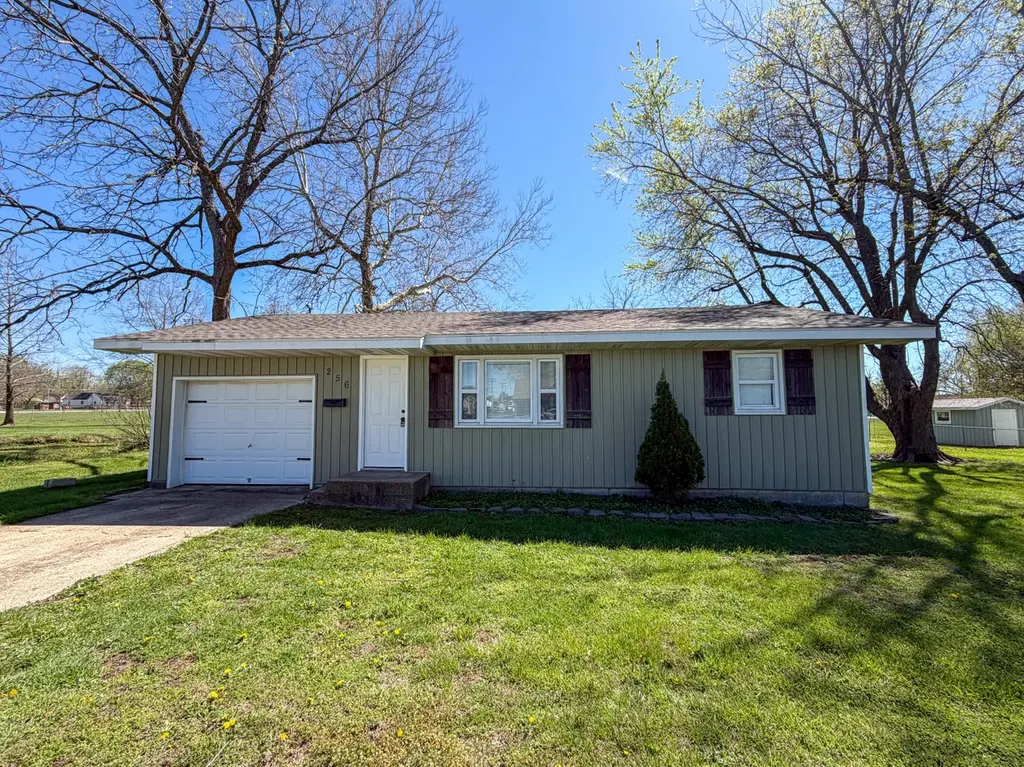
256 E 2nd St
Marshfield, MO 65706
$129,900B-
2 bd · 1.0 ba ·
996 sqft ·
Built 1963
· MultiFamily
· Pending
· 1 DOM
Cashflow @ list (25.0% down · 7.5%)
Estimated rent
$2,495/mo
Mortgage (P&I)
−$681
Tax + insurance
−$216
HOA
−$0
Vac / Maint / Mgmt
−$524
Net cashflow
$1,073/mo
Annual
$12,880/yr
Cap rate
16.21%
Cash-on-cash
35.41%
DSCR
2.58
1% rule
1.92%
Cash to close
$36,372
Investor read
- This is a 2-bed/1.0-bath multifamily listed at $130k. Condition is rated fair.
- At list price, monthly cash flow is $1k ($13k/yr) — positive.
- The deal already cash-flows at list — no discount required.
- Meets the 1% rule at list price ($2k rent vs $130k).
- Only 1 days on market — expect competitive offers; lowballing is unlikely to land.
- Local home prices are declining (-3.0%/yr); year-one equity from $898 of loan paydown is wiped out by about $4k of value loss. Plan a longer hold.
- Location reads 70/100 on livability (#137 in MO) — a middle-class / working-renter tenant base. Strengths: cost of living A+, housing A+, crime B; Watch: employment D+, amenities F, commute F.
- Marshfield R-I (town): math 32% / reading 39% proficiency, ranked #209 of 324 in MO (top 64%) — families likely to look elsewhere, expect single-tenant / working-renter base with shorter leases.
- Zoned schools: Marshfield Early Learning Cntr (174 students, 35% FRL); Marshfield Jr. High (math 35% / reading 40%, grade F, #215 of 391 statewide, top 56%, 670 students, 45% FRL); Marshfield High (math 27% / reading 45%, grade F, #313 of 521 statewide, top 60%, 916 students, 40% FRL) — zoned schools at 40% FRL track the district average.
- Market conditions: 135 active listings in the ZIP; 2 comparable units currently listed for rent nearby; 168 units permitted in Webster County in 2024 (24 in 5+ unit buildings).
- Webster County population projected at +5% by 2050 — modest demand growth; plan on rents tracking national, not racing it.
- 2 sale attempts with the ask held roughly flat each time — persistent listings suggest the price (not the market) is what's stuck; bring a comps-based counter.
- At projected returns (-3.0% appreciation + 3.0% rent growth), your $36k cash investment doubles in ~4 years — after that, you're playing with house money.
- Cap rate 16.2% vs local median 2.7% in Marshfield — top-decile yield for the area; either an underpriced asset or a hidden risk that comps aren't pricing in. Stress-test before assuming the spread holds.
Questions for listing agent
- Have any recent inspections been done? Can we get a copy of the seller's disclosures and any deferred-maintenance estimates?
- Built in 1963 — when were the roof, HVAC, electrical panel, plumbing, and water heater last replaced?
- Is there a deadline driving the sale (1031 exchange, divorce, estate, relocation)? That informs how much negotiation room exists.
- Schools are D-rated, which usually means shorter tenancies and higher turnover. Who's the typical renter profile here, and what's been the actual vacancy rate?
- What's the average days-on-market for RENTAL listings here right now (not sales)? A rising rental-DOM trend means longer vacancies and softer asking-rent achievability than the comps imply.
- What's the recent tenant-quality profile in this submarket — average credit score on applications, eviction rate, late-payment / NSF rate, and stable-employment percentage? A property-management company in the area should have these aggregated.
- How much new apartment / multifamily construction is in the pipeline within 1–3 miles? Heavy new supply (>2% of stock underway) typically softens rents 12–24 months out; light construction supports rent growth.
Repairs flagged (vision-AI assessment)
- Moderate: Exterior siding — Weathered and minor peeling
- Minor: Interior walls — Some discoloration and scuff marks
CashFlowRE · CFR-DT71A54543MMQK
· Data 3 weeks ago
cashflowre.app · 2026-05-29