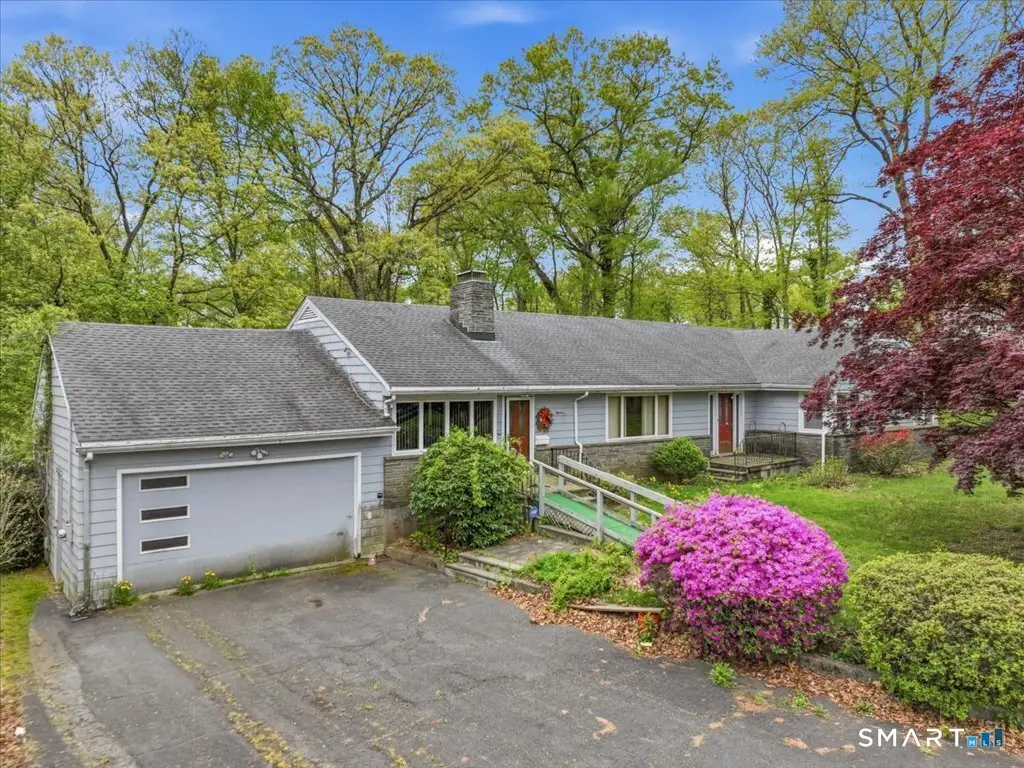
95 Westwood Dr
Plattsville, CT 06612
$599,900D+
3 bd · 2.0 ba ·
2,278 sqft ·
Built 1958
· SingleFamily
· Under Contract
· 9 DOM
Cashflow @ list (25.0% down · 7.5%)
Estimated rent
$5,281/mo
Mortgage (P&I)
−$3,146
Tax + insurance
−$1,146
HOA
−$0
Vac / Maint / Mgmt
−$1,109
Net cashflow
$-120/mo
Annual
$-1,444/yr
Cap rate
6.05%
Cash-on-cash
-0.86%
DSCR
0.96
1% rule
0.88%
Cash to close
$167,972
Investor read
- This is a 3-bed/2.0-bath single-family listed at $600k.
- At list price, monthly cash flow is $-120 ($-1k/yr) — negative.
- To cash-flow at today's rent, offer at most $579k (3.5% below list).
- To meet the 1% rule (rent ≥ 1% of price), the offer needs to be $528k (12.0% below list).
- Only 9 days on market — expect competitive offers; lowballing is unlikely to land.
- Recommended offer: $528k (12.0% below list) — sets the bar for 1% rule.
- Local home prices are declining (-3.0%/yr); year-one equity from $4k of loan paydown is wiped out by about $18k of value loss. Plan a longer hold.
- Location reads: area grade D — affects rentability + tenant quality, not the cash-flow math above.
- Regional School District 09 (rural): math 75% / reading 90% proficiency, ranked #7 of 192 in CT (top 4%) — strong family-tenant draw, lease renewals of 3-5y typical.
- Zoned schools: Samuel Staples Elementary School (math 71% / reading 74%, grade A, #61 of 553 statewide, top 11%, 605 students, 7% FRL); Helen Keller Middle School (math 64% / reading 77%, grade A, #13 of 175 statewide, top 8%, 297 students, 10% FRL); Joel Barlow High School (math 57% / reading 82%, grade B, #18 of 194 statewide, top 10%, 768 students, 12% FRL).
- Watch-outs: built in 1958 — expect roof / HVAC / electrical / plumbing capex.
- Market conditions: 35 active listings in the ZIP; 4 comparable units currently listed for rent nearby; rentals at typical pace (median 21d on market — plan ~3-4 weeks tenant-placement turnaround); 852 units permitted in Greater Bridgeport Planning Region in 2024 (698 in 5+ unit buildings).
- 2 sale attempts since 12y ago with the ask held roughly flat each time — persistent listings suggest the price (not the market) is what's stuck; bring a comps-based counter.
- Current owner paid $480k; 25% above their basis — modest negotiation headroom, anchor on the comps not their cost.
Questions for listing agent
- What do current leases actually rent for vs. the listed asking? Can we see a recent rent roll and the last 12 months of T-12 income?
- Built in 1958 — when were the roof, HVAC, electrical panel, plumbing, and water heater last replaced?
- Is there a deadline driving the sale (1031 exchange, divorce, estate, relocation)? That informs how much negotiation room exists.
- The area grade is low — what's the realistic commute time and amenity access for the typical tenant pool here? Any planned neighborhood developments (good or bad) we should know about?
- What's the average days-on-market for RENTAL listings here right now (not sales)? A rising rental-DOM trend means longer vacancies and softer asking-rent achievability than the comps imply.
- What's the recent tenant-quality profile in this submarket — average credit score on applications, eviction rate, late-payment / NSF rate, and stable-employment percentage? A property-management company in the area should have these aggregated.
- How much new for-sale + rental construction is in the pipeline within 1–3 miles? Heavy new supply typically softens prices + rents 12–24 months out; constrained supply supports both.
CashFlowRE · CFR-DVAF9B4DWAKYCF
· Data 3 weeks ago
cashflowre.app · 2026-05-29