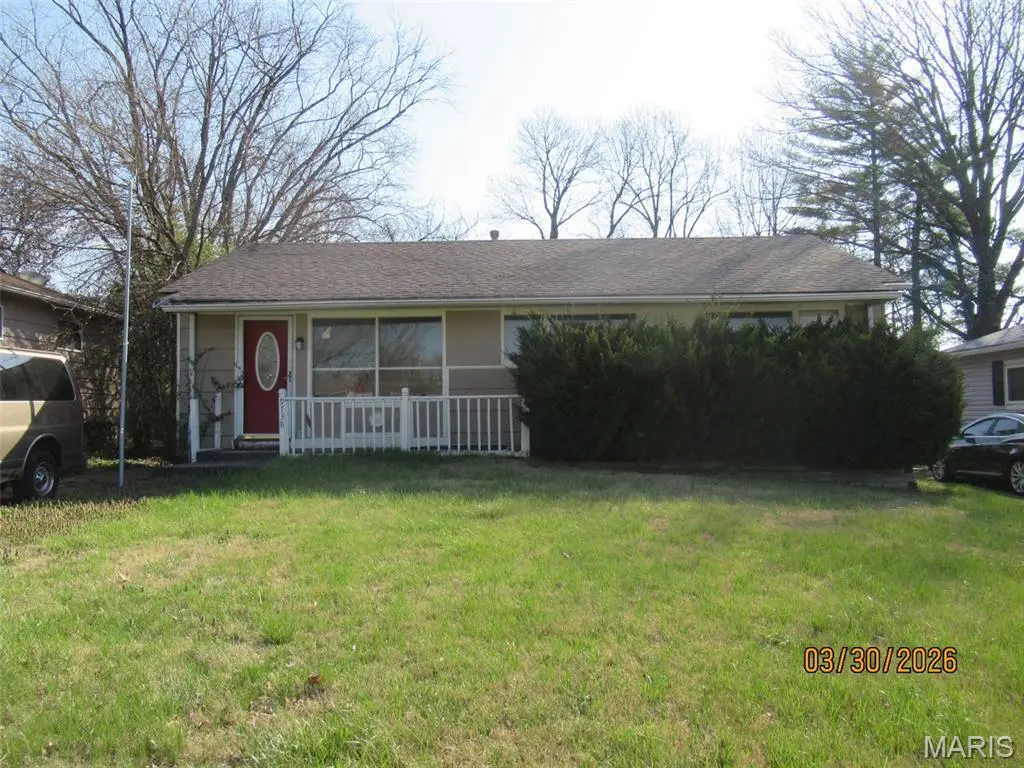
9738 Scottdale Dr
Ferguson, MO 63136
$61,500A-
3 bd · 1.0 ba ·
912 sqft ·
Built 1955
· SingleFamily
· Active
· 69 DOM
Cashflow @ list (25.0% down · 7.5%)
Estimated rent
$1,304/mo
Mortgage (P&I)
−$323
Tax + insurance
−$121
HOA
−$0
Vac / Maint / Mgmt
−$274
Net cashflow
$586/mo
Annual
$7,038/yr
Cap rate
17.74%
Cash-on-cash
40.87%
DSCR
2.82
1% rule
2.12%
Cash to close
$17,220
Investor read
- This is a 3-bed/1.0-bath single-family listed at $62k.
- At list price, monthly cash flow is $586 ($7k/yr) — positive.
- The deal already cash-flows at list — no discount required.
- Meets the 1% rule at list price ($1k rent vs $62k).
- It's been on market 69 days — a 6% lower offer ($58k) is reasonable based on typical stale-listing flexibility.
- Recommended offer: $58k (6.0% below list) — sets the bar for market timing.
- In year one you build about $3k of equity ($425 loan paydown + $2k appreciation (3.8% local appreciation)).
- Location reads 58/100 on livability (#586 in MO) — a working-class tenant base; expect higher turnover. Strengths: cost of living A+, housing B+; Watch: health & safety C-, schools F, crime F.
- Riverview Gardens (suburban): math 2% / reading 9% proficiency, ranked #324 of 324 in MO (top 100%) — low school quality limits family demand, transient renter base, plan for 1-2y turnover; 90% free/reduced lunch — lower-income household profile, screen leases tightly.
- Watch-outs: built in 1955 — expect roof / HVAC / electrical / plumbing capex.
- Market conditions: Rents rising fast (+5.0%/yr); 372 active listings in the ZIP; 40 comparable units currently listed for rent nearby; rentals at typical pace (median 24d on market — plan ~3-4 weeks tenant-placement turnaround); 45% of comp listings sitting > 30 days — soft ceiling on asking rent; lower-income renter base — watch delinquency; 920 units permitted in St. Louis County in 2024 (250 in 5+ unit buildings).
- 4 sale attempts with the ask held roughly flat each time — persistent listings suggest the price (not the market) is what's stuck; bring a comps-based counter.
- At projected returns (3.8% appreciation + 5.0% rent growth), your $17k cash investment doubles in ~2 years — after that, you're playing with house money.
- Climate carrying-cost: extreme-heat days projected 7→21/yr by 2055 (HVAC capex compounding) — expect insurance premiums to compound above CPI over the hold.
- Cap rate 17.7% vs local median 9.2% in Ferguson — top-decile yield for the area; either an underpriced asset or a hidden risk that comps aren't pricing in. Stress-test before assuming the spread holds.
- This rent runs 38% of the median local income ($41k/yr) — at the standard rent-burdened threshold; future hikes will face affordability resistance.
Questions for listing agent
- It's been on market 69 days. Have you received any prior offers? Is the seller open to a 6% concession, seller financing, or rate buy-down credit?
- Built in 1955 — when were the roof, HVAC, electrical panel, plumbing, and water heater last replaced?
- Why hasn't it sold? Are there any deal-killer items the seller is aware of (foundation, flood, title, zoning, code violations)?
- Is there a deadline driving the sale (1031 exchange, divorce, estate, relocation)? That informs how much negotiation room exists.
- Schools are F-rated, which usually means shorter tenancies and higher turnover. Who's the typical renter profile here, and what's been the actual vacancy rate?
- Crime grade is F in this area — have there been break-ins, vandalism, or insurance claims at this property in the last 3 years? What carrier currently insures it and at what premium?
- What's the average days-on-market for RENTAL listings here right now (not sales)? A rising rental-DOM trend means longer vacancies and softer asking-rent achievability than the comps imply.
- What's the recent tenant-quality profile in this submarket — average credit score on applications, eviction rate, late-payment / NSF rate, and stable-employment percentage? A property-management company in the area should have these aggregated.
CashFlowRE · CFR-DZ3DV32GYGVGA8
· Data 2 days ago
cashflowre.app · 2026-05-29