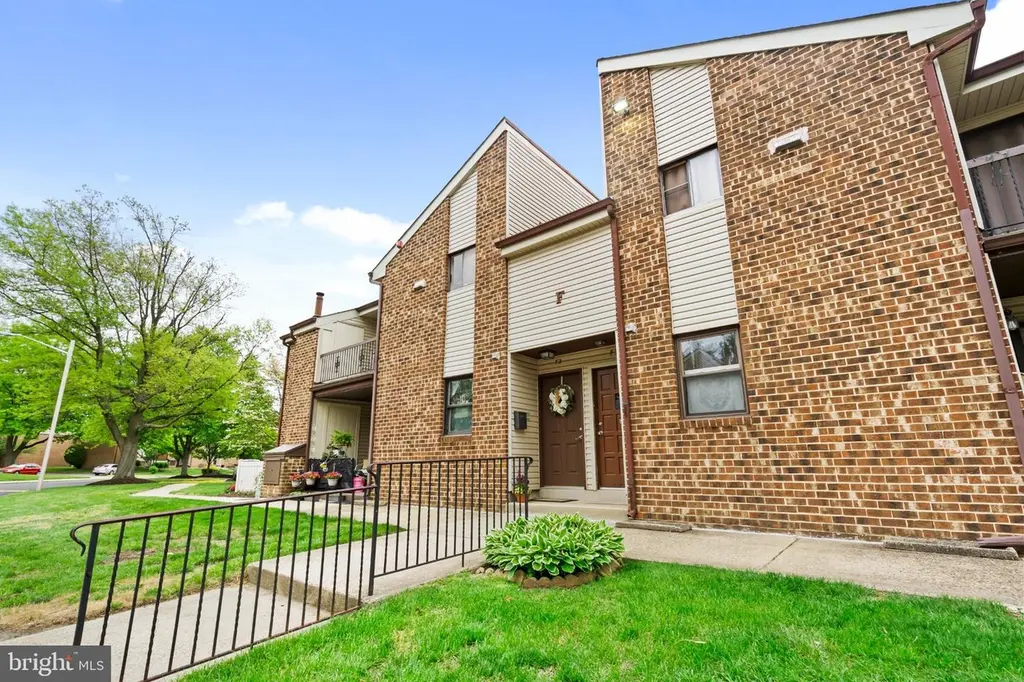
1475 Mount Holly Rd Unit F2
Beverly, NJ 08010
$169,900D
1 bd · 1.0 ba ·
1,024 sqft ·
Built 1971
· Condo
· Pending
· 13 DOM
Cashflow @ list (25.0% down · 7.5%)
Estimated rent
$1,728/mo
Mortgage (P&I)
−$891
Tax + insurance
−$225
HOA
−$229
Vac / Maint / Mgmt
−$363
Net cashflow
$21/mo
Annual
$248/yr
Cap rate
6.44%
Cash-on-cash
0.52%
DSCR
1.02
1% rule
1.02%
Cash to close
$47,572
Investor read
- This is a 1-bed/1.0-bath condo listed at $170k.
- At list price, monthly cash flow is $21 ($248/yr) — positive.
- The deal already cash-flows at list — no discount required.
- Meets the 1% rule at list price ($2k rent vs $170k).
- Only 13 days on market — expect competitive offers; lowballing is unlikely to land.
- Local home prices are declining (-3.0%/yr); year-one equity from $1k of loan paydown is wiped out by about $5k of value loss. Plan a longer hold.
- Location reads 76/100 on livability (#130 in NJ, #3,487 nationally) — a middle-class / working-renter tenant base. Strengths: employment A+, housing A+, commute A; Watch: amenities F.
- Edgewater Park Township School District (suburban): math 9% / reading 32% proficiency, ranked #418 of 472 in NJ (top 89%) — low school quality limits family demand, transient renter base, plan for 1-2y turnover.
- Zoned schools: Mildred Magowan Elementary School (math 2% / reading 32%, grade F, #1,065 of 1,303 statewide, top 83%, 525 students, 52% FRL); Samuel M Ridgway Middle School (math 11% / reading 33%, grade F, #383 of 431 statewide, top 90%, 417 students, 55% FRL) — zoned schools average 53% FRL vs 38% district-wide (16 pts higher); higher-poverty schools than district average — tighter screening recommended.
- Market conditions: 66 active listings in the ZIP; 10 comparable units currently listed for rent nearby; rentals at typical pace (median 22d on market — plan ~3-4 weeks tenant-placement turnaround); solid renter incomes; 2,161 units permitted in Burlington County in 2024 (988 in 5+ unit buildings).
- Burlington County population projected to shrink 5% by 2050 — rents likely to lag national; underwrite the cash flow, not the appreciation.
- 9 sale attempts since 23y ago with the ask held roughly flat each time — persistent listings suggest the price (not the market) is what's stuck; bring a comps-based counter.
- Current owner paid $25k; list at $170k implies a 580% gain — meaningful room to come down on a strong offer.
- Cap rate 6.4% vs local median 5.1% in Beverly — meaningfully above typical; check what's discounted (condition, days-on-market, listing class) to confirm the premium yield is real.
Questions for listing agent
- Built in 1971 — when were the roof, HVAC, electrical panel, plumbing, and water heater last replaced?
- What does the HOA fee cover, when was the last increase, and are there any pending special assessments or reserve-fund shortfalls?
- Any open or pending special assessments — roof, HVAC, plumbing, elevator, façade? What's the per-unit balance and payoff schedule, and is the seller paying it off at close or rolling it to the buyer?
- Is there a deadline driving the sale (1031 exchange, divorce, estate, relocation)? That informs how much negotiation room exists.
- The area grade is low — what's the realistic commute time and amenity access for the typical tenant pool here? Any planned neighborhood developments (good or bad) we should know about?
- What's the average days-on-market for RENTAL listings here right now (not sales)? A rising rental-DOM trend means longer vacancies and softer asking-rent achievability than the comps imply.
- What's the recent tenant-quality profile in this submarket — average credit score on applications, eviction rate, late-payment / NSF rate, and stable-employment percentage? A property-management company in the area should have these aggregated.
- How much new apartment / multifamily construction is in the pipeline within 1–3 miles? Heavy new supply (>2% of stock underway) typically softens rents 12–24 months out; light construction supports rent growth.
CashFlowRE · CFR-E1HDVKA1HAJVE2
· Data 1 week ago
cashflowre.app · 2026-05-29