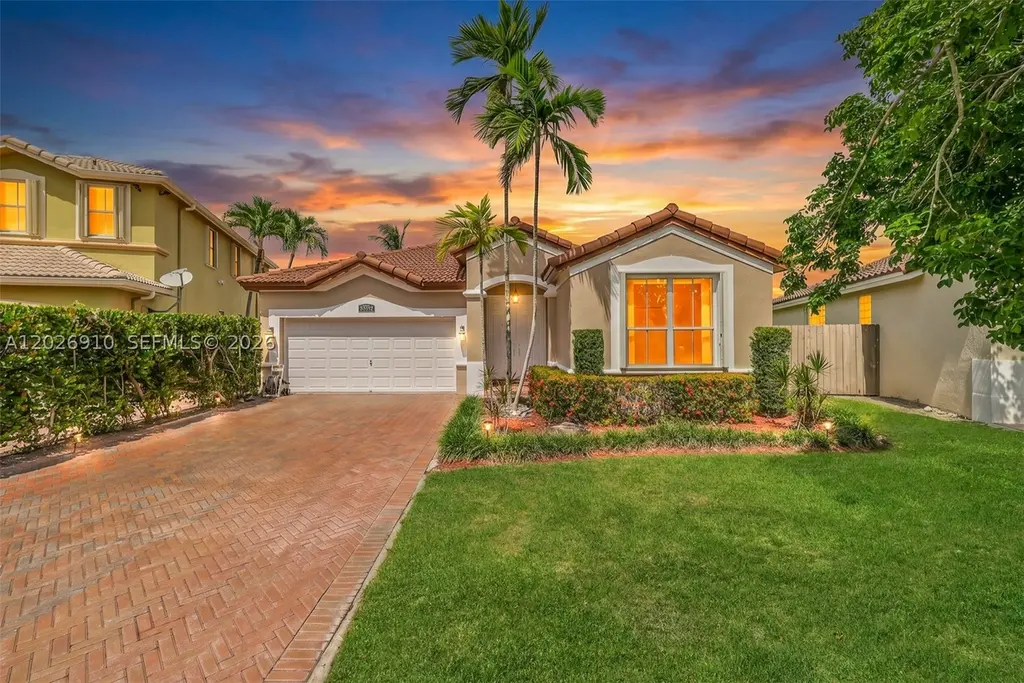
4402 SW 162nd Pl
Kendall West, FL 33185
$650,000D+
3 bd · 2.0 ba ·
2,054 sqft ·
Built 2002
· SingleFamily
· Pending
· 7 DOM
Cashflow @ list (25.0% down · 7.5%)
Estimated rent
$4,234/mo
Mortgage (P&I)
−$3,409
Tax + insurance
−$493
HOA
−$97
Vac / Maint / Mgmt
−$889
Net cashflow
$-654/mo
Annual
$-7,854/yr
Cap rate
5.08%
Cash-on-cash
-4.32%
DSCR
0.81
1% rule
0.65%
Cash to close
$182,000
Investor read
- This is a 3-bed/2.0-bath single-family listed at $650k.
- At list price, monthly cash flow is $-654 ($-8k/yr) — negative.
- To cash-flow at today's rent, offer at most $534k (17.8% below list).
- To meet the 1% rule (rent ≥ 1% of price), the offer needs to be $423k (34.9% below list).
- Only 7 days on market — expect competitive offers; lowballing is unlikely to land.
- Recommended offer: $423k (34.9% below list) — sets the bar for 1% rule.
- In year one you build about $10k of equity ($4k loan paydown + $5k appreciation (0.8% local appreciation)).
- Location reads 75/100 on livability (#255 in FL, #4,028 nationally) — a middle-class / working-renter tenant base. Strengths: housing A+, health & safety A+, crime A-; Watch: schools C-, amenities F.
- Miami-Dade (suburban): math 45% / reading 54% proficiency, ranked #40 of 73 in FL (top 55%) — families likely to look elsewhere, expect single-tenant / working-renter base with shorter leases; 64% free/reduced lunch — lower-income household profile, screen leases tightly.
- Market conditions: Rents rising fast (+5.4%/yr); 133 active listings in the ZIP; 40 comparable units currently listed for rent nearby; rentals at typical pace (median 25d on market — plan ~3-4 weeks tenant-placement turnaround); high-income renter base; 10,051 units permitted in Miami-Dade County in 2024 (7,758 in 5+ unit buildings).
- Miami-Dade County population projected at +28% by 2050 — long-run rental-demand tailwind backs the buy-and-hold thesis.
- 2 sale attempts with the ask held roughly flat each time — persistent listings suggest the price (not the market) is what's stuck; bring a comps-based counter.
- Current owner paid $288k; list at $650k implies a 126% gain — meaningful room to come down on a strong offer.
- By year 5, paydown + projected appreciation supports a ~$46k cash-out refi (75% LTV) — recoverable capital for the next deal without selling this one.
- Cap rate 5.1% vs local median 3.6% in Kendall West — top-decile yield for the area; either an underpriced asset or a hidden risk that comps aren't pricing in. Stress-test before assuming the spread holds.
- This rent runs 44% of the median local income ($114k/yr) — at the standard rent-burdened threshold; future hikes will face affordability resistance.
Questions for listing agent
- What do current leases actually rent for vs. the listed asking? Can we see a recent rent roll and the last 12 months of T-12 income?
- What does the HOA fee cover, when was the last increase, and are there any pending special assessments or reserve-fund shortfalls?
- Is there a deadline driving the sale (1031 exchange, divorce, estate, relocation)? That informs how much negotiation room exists.
- The area grade is low — what's the realistic commute time and amenity access for the typical tenant pool here? Any planned neighborhood developments (good or bad) we should know about?
- This sits on a lake — are riparian / water-frontage rights deeded with the parcel? Any dock permits, shoreline easements, or HOA water-use restrictions?
- What's the documented flood / surge / shoreline-erosion history here (FEMA AND non-FEMA — e.g., storm surge, creek backup, septic-field saturation)?
- Any water-quality or seasonal algae-bloom issues that affect tenant satisfaction or short-term-rental demand?
- What's the average days-on-market for RENTAL listings here right now (not sales)? A rising rental-DOM trend means longer vacancies and softer asking-rent achievability than the comps imply.
CashFlowRE · CFR-E2ZVGZERS5KN41
· Data 1 week ago
cashflowre.app · 2026-05-29