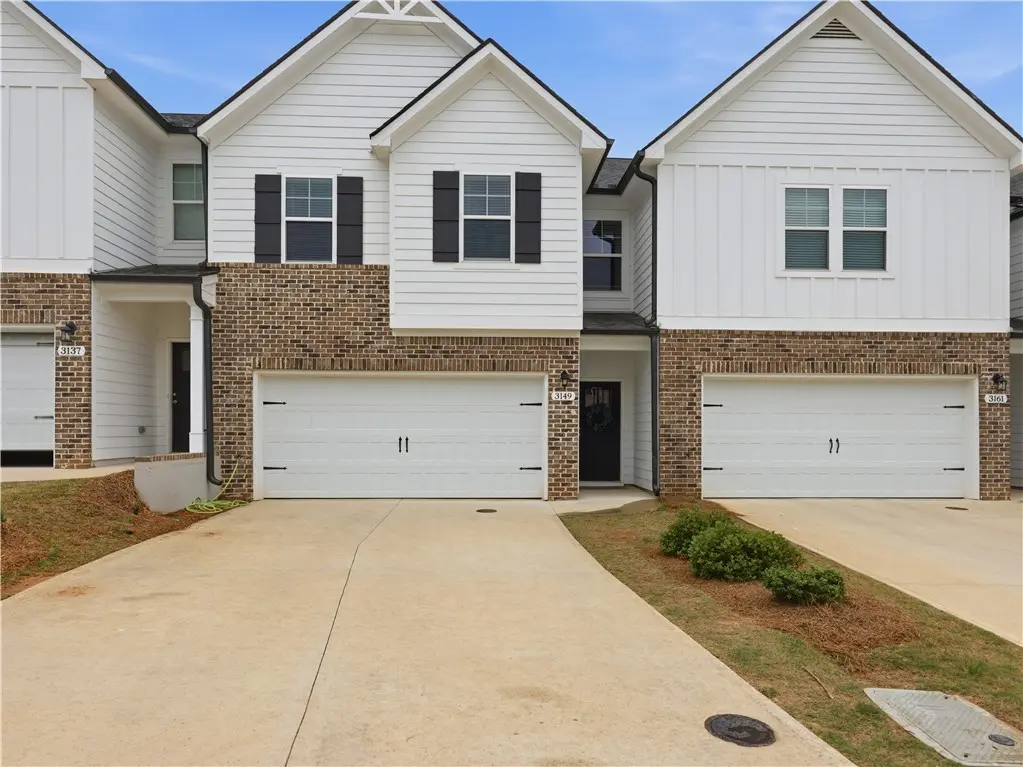
3149 Raiden Cir
Opelika, AL 36804
$285,000D-
3 bd · 2.5 ba ·
2,040 sqft ·
Built 2023
· Townhouse
· Active
· 51 DOM
Cashflow @ list (25.0% down · 7.5%)
Estimated rent
$2,019/mo
Mortgage (P&I)
−$1,495
Tax + insurance
−$236
HOA
−$125
Vac / Maint / Mgmt
−$424
Net cashflow
$-260/mo
Annual
$-3,118/yr
Cap rate
5.20%
Cash-on-cash
-3.91%
DSCR
0.83
1% rule
0.71%
Cash to close
$79,800
Investor read
- This is a 3-bed/2.5-bath townhouse listed at $285k.
- At list price, monthly cash flow is $-260 ($-3k/yr) — negative.
- To cash-flow at today's rent, offer at most $239k (16.1% below list).
- To meet the 1% rule (rent ≥ 1% of price), the offer needs to be $202k (29.1% below list).
- It's been on market 51 days — a 3% lower offer ($276k) is reasonable based on typical stale-listing flexibility.
- Recommended offer: $202k (29.1% below list) — sets the bar for 1% rule.
- Local home prices are declining (-3.0%/yr); year-one equity from $2k of loan paydown is wiped out by about $9k of value loss. Plan a longer hold.
- Location reads 63/100 on livability (#188 in AL) — a middle-class / working-renter tenant base. Strengths: cost of living A+, housing A+; Watch: schools C-, employment C-, crime F.
- Opelika City (urban): math 27% / reading 43% proficiency, ranked #45 of 129 in AL (top 35%) — families likely to look elsewhere, expect single-tenant / working-renter base with shorter leases; 62% free/reduced lunch — lower-income household profile, screen leases tightly.
- Market conditions: 395 active listings in the ZIP; 2 comparable units currently listed for rent nearby; 1,858 units permitted in Lee County in 2024 (113 in 5+ unit buildings).
- Lee County population projected at +54% by 2050 — long-run rental-demand tailwind backs the buy-and-hold thesis.
- 2 sale attempts since 4y ago with the ask held roughly flat each time — persistent listings suggest the price (not the market) is what's stuck; bring a comps-based counter.
- Cap rate 5.2% vs local median 3.8% in Opelika — top-decile yield for the area; either an underpriced asset or a hidden risk that comps aren't pricing in. Stress-test before assuming the spread holds.
- This rent runs 39% of the median local income ($62k/yr) — at the standard rent-burdened threshold; future hikes will face affordability resistance.
Questions for listing agent
- What do current leases actually rent for vs. the listed asking? Can we see a recent rent roll and the last 12 months of T-12 income?
- It's been on market 51 days. Have you received any prior offers? Is the seller open to a 29% concession, seller financing, or rate buy-down credit?
- What does the HOA fee cover, when was the last increase, and are there any pending special assessments or reserve-fund shortfalls?
- Is there a deadline driving the sale (1031 exchange, divorce, estate, relocation)? That informs how much negotiation room exists.
- Crime grade is F in this area — have there been break-ins, vandalism, or insurance claims at this property in the last 3 years? What carrier currently insures it and at what premium?
- The area grade is low — what's the realistic commute time and amenity access for the typical tenant pool here? Any planned neighborhood developments (good or bad) we should know about?
- What's the average days-on-market for RENTAL listings here right now (not sales)? A rising rental-DOM trend means longer vacancies and softer asking-rent achievability than the comps imply.
- What's the recent tenant-quality profile in this submarket — average credit score on applications, eviction rate, late-payment / NSF rate, and stable-employment percentage? A property-management company in the area should have these aggregated.
CashFlowRE · CFR-E3SWZ9E7H2V1JX
· Data 1 day ago
cashflowre.app · 2026-05-29