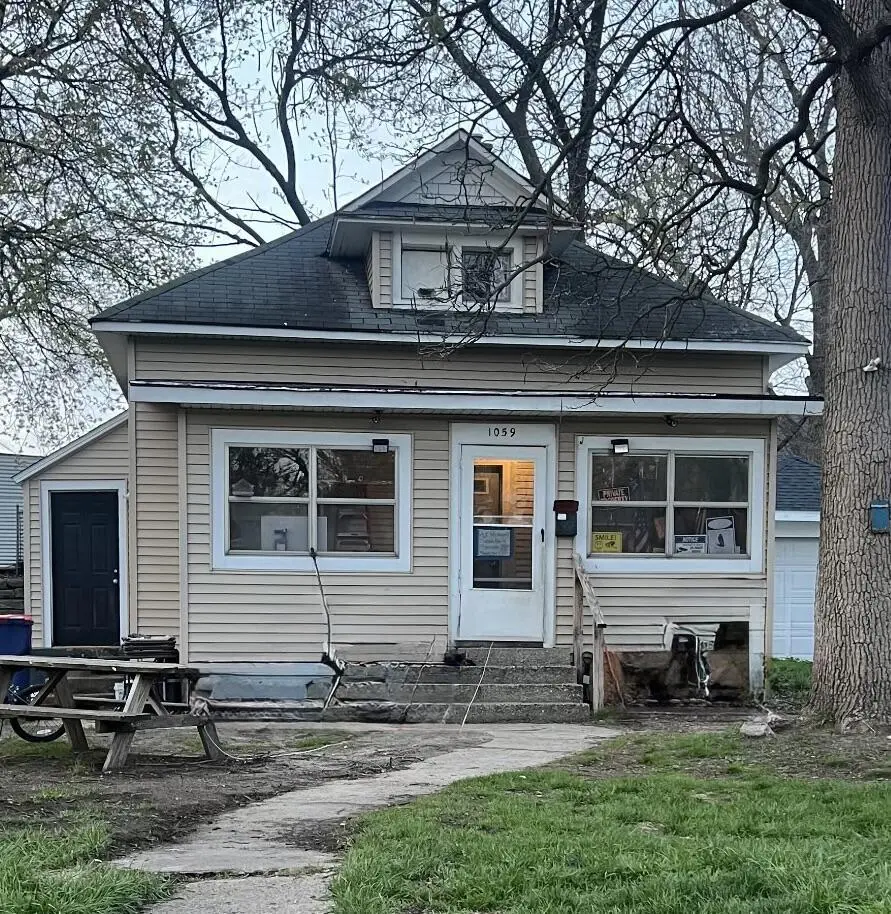
1059 Sherman St SE
Grand Rapids, MI 49506
$153,000C+
3 bd · 1.0 ba ·
650 sqft ·
Built 1880
· SingleFamily
· Active
· 61 DOM
Cashflow @ list (25.0% down · 7.5%)
Estimated rent
$1,764/mo
Mortgage (P&I)
−$802
Tax + insurance
−$255
HOA
−$0
Vac / Maint / Mgmt
−$370
Net cashflow
$336/mo
Annual
$4,034/yr
Cap rate
8.93%
Cash-on-cash
9.42%
DSCR
1.42
1% rule
1.15%
Cash to close
$42,840
Investor read
- This is a 3-bed/1.0-bath single-family listed at $153k.
- At list price, monthly cash flow is $336 ($4k/yr) — positive.
- The deal already cash-flows at list — no discount required.
- Meets the 1% rule at list price ($2k rent vs $153k).
- It's been on market 61 days — a 6% lower offer ($144k) is reasonable based on typical stale-listing flexibility.
- Recommended offer: $144k (6.0% below list) — sets the bar for market timing.
- Local home prices are declining (-3.0%/yr); year-one equity from $1k of loan paydown is wiped out by about $5k of value loss. Plan a longer hold.
- Location reads 83/100 on livability (#44 in MI, #939 nationally) — a professional / high-income tenant draw. Strengths: amenities A+, commute A+, cost of living A+; Watch: employment C-, crime F.
- Grand Rapids Public Schools (urban): math 15% / reading 29% proficiency, ranked #451 of 540 in MI (top 84%) — low school quality limits family demand, transient renter base, plan for 1-2y turnover; 80% free/reduced lunch — lower-income household profile, screen leases tightly.
- Watch-outs: built in 1880 — expect roof / HVAC / electrical / plumbing capex.
- Market conditions: Rents rising fast (+6.9%/yr); 209 active listings in the ZIP; 12 comparable units currently listed for rent nearby; rentals lingering (median 45d on market — plan ~5-8 weeks vacancy on turnover, expect pricing pressure); 67% of comp listings sitting > 30 days — soft ceiling on asking rent; high-income renter base; 2,253 units permitted in Kent County in 2024 (969 in 5+ unit buildings).
- Kent County population projected at +22% by 2050 — long-run rental-demand tailwind backs the buy-and-hold thesis.
- 3 sale attempts with the ask held roughly flat each time — persistent listings suggest the price (not the market) is what's stuck; bring a comps-based counter.
- At projected returns (-3.0% appreciation + 6.9% rent growth), your $43k cash investment doubles in ~8 years — after that, you're playing with house money.
- Cap rate 8.9% vs local median 4.5% in Grand Rapids — top-decile yield for the area; either an underpriced asset or a hidden risk that comps aren't pricing in. Stress-test before assuming the spread holds.
- This rent is only 18% of the median local income ($118k/yr) — well below the 30% rent-burden line; pricing power to push rent on renewal without tenant pushback.
Questions for listing agent
- It's been on market 61 days. Have you received any prior offers? Is the seller open to a 6% concession, seller financing, or rate buy-down credit?
- Built in 1880 — when were the roof, HVAC, electrical panel, plumbing, and water heater last replaced?
- Why hasn't it sold? Are there any deal-killer items the seller is aware of (foundation, flood, title, zoning, code violations)?
- Is there a deadline driving the sale (1031 exchange, divorce, estate, relocation)? That informs how much negotiation room exists.
- Crime grade is F in this area — have there been break-ins, vandalism, or insurance claims at this property in the last 3 years? What carrier currently insures it and at what premium?
- What's the average days-on-market for RENTAL listings here right now (not sales)? A rising rental-DOM trend means longer vacancies and softer asking-rent achievability than the comps imply.
- What's the recent tenant-quality profile in this submarket — average credit score on applications, eviction rate, late-payment / NSF rate, and stable-employment percentage? A property-management company in the area should have these aggregated.
- How much new for-sale + rental construction is in the pipeline within 1–3 miles? Heavy new supply typically softens prices + rents 12–24 months out; constrained supply supports both.
CashFlowRE · CFR-E4CXK30T2TV8T2
· Data 8 h ago
cashflowre.app · 2026-05-29