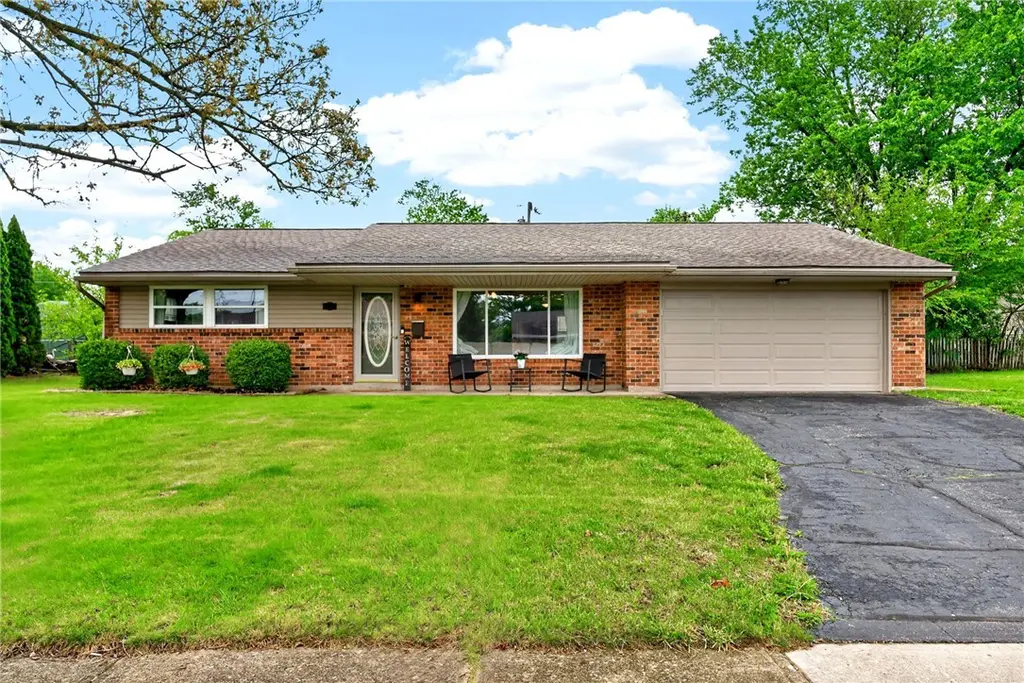
1003 Heathwood Dr
Englewood, OH 45322
$219,900D
3 bd · 1.5 ba ·
1,448 sqft ·
Built 1965
· SingleFamily
· Pending
· 3 DOM
Cashflow @ list (25.0% down · 7.5%)
Estimated rent
$1,932/mo
Mortgage (P&I)
−$1,153
Tax + insurance
−$372
HOA
−$0
Vac / Maint / Mgmt
−$406
Net cashflow
$1/mo
Annual
$12/yr
Cap rate
6.30%
Cash-on-cash
0.02%
DSCR
1.00
1% rule
0.88%
Cash to close
$61,572
Investor read
- This is a 3-bed/1.5-bath single-family listed at $220k.
- At list price, monthly cash flow is $1 ($12/yr) — positive.
- The deal already cash-flows at list — no discount required.
- To meet the 1% rule (rent ≥ 1% of price), the offer needs to be $193k (12.2% below list).
- Only 3 days on market — expect competitive offers; lowballing is unlikely to land.
- Recommended offer: $193k (12.2% below list) — sets the bar for 1% rule.
- Local home prices are declining (-3.0%/yr); year-one equity from $2k of loan paydown is wiped out by about $7k of value loss. Plan a longer hold.
- Location reads 69/100 on livability (#517 in OH) — a middle-class / working-renter tenant base. Strengths: cost of living A+, housing A+; Watch: employment C-, amenities F, commute F.
- Northmont City (suburban): math 52% / reading 62% proficiency, ranked #318 of 656 in OH (top 48%) — acceptable for families but not a draw, mixed tenant base, ~2y average lease.
- Zoned schools: Kleptz Early Childhood Learning Center (833 students, 34% FRL); Northmont Middle School (math 47% / reading 58%, grade C+, #378 of 654 statewide, top 59%, 777 students, 37% FRL); Northmont High School (math 37% / reading 64%, grade D+, #380 of 781 statewide, top 49%, 1,392 students, 34% FRL).
- Market conditions: Rents soft (-0.5%/yr); 90 active listings in the ZIP; 9 comparable units currently listed for rent nearby; rentals leasing fast (median 5d on market — plan ~1-2 weeks tenant-placement turnaround); solid renter incomes; 907 units permitted in Montgomery County in 2024 (416 in 5+ unit buildings).
- Montgomery County population projected at -10% by 2050 — secular population decline; favor cash flow + early exit over multi-decade hold.
- 2 sale attempts since 6y ago with the ask held roughly flat each time — persistent listings suggest the price (not the market) is what's stuck; bring a comps-based counter.
- This rent runs 31% of the median local income ($75k/yr) — at the standard rent-burdened threshold; future hikes will face affordability resistance.
Questions for listing agent
- Built in 1965 — when were the roof, HVAC, electrical panel, plumbing, and water heater last replaced?
- Is there a deadline driving the sale (1031 exchange, divorce, estate, relocation)? That informs how much negotiation room exists.
- Schools are A-rated — typically a magnet for longer-tenancy family renters. What's the average tenant stay here, and is there a school-zone premium baked into asking?
- The area grade is low — what's the realistic commute time and amenity access for the typical tenant pool here? Any planned neighborhood developments (good or bad) we should know about?
- What's the average days-on-market for RENTAL listings here right now (not sales)? A rising rental-DOM trend means longer vacancies and softer asking-rent achievability than the comps imply.
- What's the recent tenant-quality profile in this submarket — average credit score on applications, eviction rate, late-payment / NSF rate, and stable-employment percentage? A property-management company in the area should have these aggregated.
- How much new for-sale + rental construction is in the pipeline within 1–3 miles? Heavy new supply typically softens prices + rents 12–24 months out; constrained supply supports both.
CashFlowRE · CFR-E5EVS776MPBJPD
· Data 4 weeks ago
cashflowre.app · 2026-05-29