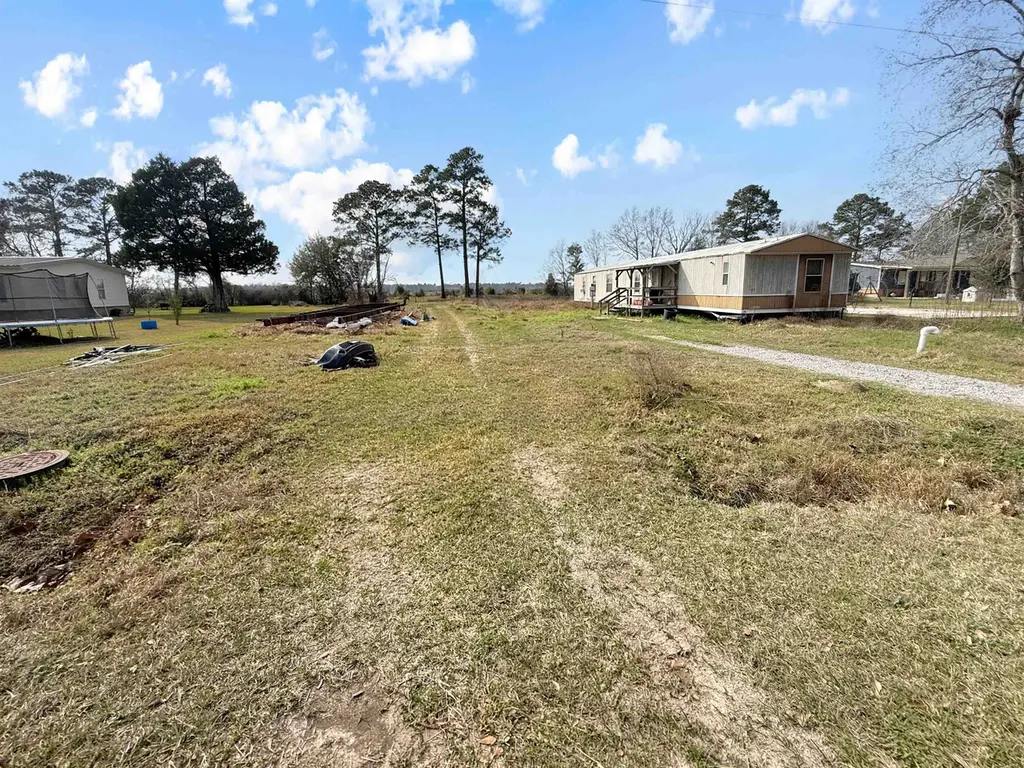
4180 Carlene St
Bridge City, TX 77630
$65,000B+
3 bd · 2.0 ba ·
1,120 sqft ·
Built 2000
· Manufactured
· Active
· 104 DOM
Cashflow @ list (25.0% down · 7.5%)
Estimated rent
$1,357/mo
Mortgage (P&I)
−$341
Tax + insurance
−$141
HOA
−$0
Vac / Maint / Mgmt
−$285
Net cashflow
$589/mo
Annual
$7,073/yr
Cap rate
18.40%
Cash-on-cash
43.24%
DSCR
2.92
1% rule
2.09%
Cash to close
$18,200
Investor read
- This is a 3-bed/2.0-bath manufactured listed at $65k.
- At list price, monthly cash flow is $589 ($7k/yr) — positive.
- The deal already cash-flows at list — no discount required.
- Meets the 1% rule at list price ($1k rent vs $65k).
- It's been on market 104 days — a 9% lower offer ($59k) is reasonable based on typical stale-listing flexibility.
- Recommended offer: $59k (9.0% below list) — sets the bar for market timing.
- In year one you build about $1k of equity ($449 loan paydown + $656 appreciation (1.0% local appreciation)).
- Location reads 72/100 on livability (#251 in TX) — a middle-class / working-renter tenant base. Strengths: crime A+, employment A+, cost of living A+; Watch: amenities F, commute F.
- Orangefield ISD (rural): math 44% / reading 48% proficiency, ranked #217 of 826 in TX (top 26%) — families likely to look elsewhere, expect single-tenant / working-renter base with shorter leases.
- Zoned schools: Orangefield El (math 44% / reading 44%, grade F, #1,243 of 4,322 statewide, top 29%, 873 students, 39% FRL); Orangefield J H (math 42% / reading 48%, grade D, #479 of 1,662 statewide, top 29%, 434 students, 34% FRL); Orangefield H S (math 52% / reading 57%, grade C-, #379 of 1,632 statewide, top 26%, 549 students, 35% FRL) — zoned schools at 36% FRL track the district average.
- Watch-outs: flood insurance adds $66/mo.
- Market conditions: Rents rising fast (+5.7%/yr); 338 active listings in the ZIP; 1 comparable units currently listed for rent nearby; 235 units permitted in Orange County in 2024 (50 in 5+ unit buildings).
- Orange County population projected at +6% by 2050 — modest demand growth; plan on rents tracking national, not racing it.
- At projected returns (1.0% appreciation + 5.7% rent growth), your $18k cash investment doubles in ~3 years — after that, you're playing with house money.
- Climate carrying-cost: severe flood risk; severe wind risk, 99% chance of damaging wind over 30y; extreme-heat days projected 7→23/yr by 2055 (HVAC capex compounding) — expect insurance premiums to compound above CPI over the hold.
- Cap rate 18.4% vs local median 2.2% in Bridge City — top-decile yield for the area; either an underpriced asset or a hidden risk that comps aren't pricing in. Stress-test before assuming the spread holds.
Questions for listing agent
- It's been on market 104 days. Have you received any prior offers? Is the seller open to a 9% concession, seller financing, or rate buy-down credit?
- What's the actual annual flood-insurance premium (NFIP or private), and is the property in a SFHA with mandatory coverage?
- Why hasn't it sold? Are there any deal-killer items the seller is aware of (foundation, flood, title, zoning, code violations)?
- Is there a deadline driving the sale (1031 exchange, divorce, estate, relocation)? That informs how much negotiation room exists.
- What's the average days-on-market for RENTAL listings here right now (not sales)? A rising rental-DOM trend means longer vacancies and softer asking-rent achievability than the comps imply.
- What's the recent tenant-quality profile in this submarket — average credit score on applications, eviction rate, late-payment / NSF rate, and stable-employment percentage? A property-management company in the area should have these aggregated.
- How much new for-sale + rental construction is in the pipeline within 1–3 miles? Heavy new supply typically softens prices + rents 12–24 months out; constrained supply supports both.
CashFlowRE · CFR-E6GNV01D6VHQTS
· Data 19 h ago
cashflowre.app · 2026-05-29