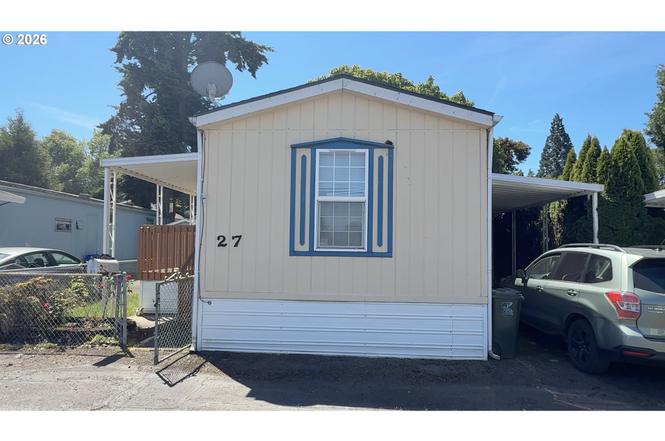
2710 SE Courtney Ave #27
Oak Grove, OR 97222
$25,000D
2 bd · 1.0 ba ·
670 sqft ·
Built 1995
· Other
· Active
· 3 DOM
Cashflow @ list (25.0% down · 7.5%)
Estimated rent
$1,552/mo
Mortgage (P&I)
−$131
Tax + insurance
−$32
HOA
−$680
Vac / Maint / Mgmt
−$326
Net cashflow
$383/mo
Annual
$4,594/yr
Cap rate
24.67%
Cash-on-cash
65.63%
DSCR
3.92
1% rule
6.21%
Cash to close
$7,000
Investor read
- This is a 2-bed/1.0-bath other listed at $25k.
- At list price, monthly cash flow is $383 ($5k/yr) — positive.
- The deal already cash-flows at list — no discount required.
- Meets the 1% rule at list price ($2k rent vs $25k).
- Only 3 days on market — expect competitive offers; lowballing is unlikely to land.
- Local home prices are declining (-3.0%/yr); year-one equity from $173 of loan paydown is wiped out by about $750 of value loss. Plan a longer hold.
- Location reads 84/100 on livability (#37 in OR, #832 nationally) — a professional / high-income tenant draw. Strengths: amenities A+, commute A+, health & safety A+; Watch: cost of living F.
- North Clackamas SD 12 (suburban): math 29% / reading 43% proficiency, ranked #22 of 58 in OR (top 38%) — families likely to look elsewhere, expect single-tenant / working-renter base with shorter leases.
- Zoned schools: Oak Grove Elementary (math 10% / reading 30%, grade F, #358 of 412 statewide, top 89%, 283 students, 76% FRL); Alder Creek Middle School (math 13% / reading 36%, grade F, #108 of 128 statewide, top 89%, 846 students, 49% FRL); Putnam High School (math 34% / reading 74%, grade C-, #30 of 143 statewide, top 20%, 1,106 students, 38% FRL) — zoned schools average 54% FRL vs 34% district-wide (20 pts higher); higher-poverty schools than district average — tighter screening recommended.
- Watch-outs: HOA is 44% of rent.
- Market conditions: Rents soft (-0.8%/yr); 139 active listings in the ZIP; 21 comparable units currently listed for rent nearby; rentals at typical pace (median 24d on market — plan ~3-4 weeks tenant-placement turnaround); solid renter incomes; 946 units permitted in Clackamas County in 2024 (188 in 5+ unit buildings).
- Clackamas County population projected at +25% by 2050 — long-run rental-demand tailwind backs the buy-and-hold thesis.
- At projected returns (-3.0% appreciation + 0.0% rent growth), your $7k cash investment doubles in ~2 years — after that, you're playing with house money.
- Cap rate 24.7% vs local median 2.7% in Oak Grove — top-decile yield for the area; either an underpriced asset or a hidden risk that comps aren't pricing in. Stress-test before assuming the spread holds.
Questions for listing agent
- What does the HOA fee cover, when was the last increase, and are there any pending special assessments or reserve-fund shortfalls?
- Is there a deadline driving the sale (1031 exchange, divorce, estate, relocation)? That informs how much negotiation room exists.
- The area grade is low — what's the realistic commute time and amenity access for the typical tenant pool here? Any planned neighborhood developments (good or bad) we should know about?
- What's the average days-on-market for RENTAL listings here right now (not sales)? A rising rental-DOM trend means longer vacancies and softer asking-rent achievability than the comps imply.
- What's the recent tenant-quality profile in this submarket — average credit score on applications, eviction rate, late-payment / NSF rate, and stable-employment percentage? A property-management company in the area should have these aggregated.
- How much new for-sale + rental construction is in the pipeline within 1–3 miles? Heavy new supply typically softens prices + rents 12–24 months out; constrained supply supports both.
CashFlowRE · CFR-E7TH7G8FMCYRZF
· Data 1 day ago
cashflowre.app · 2026-05-29