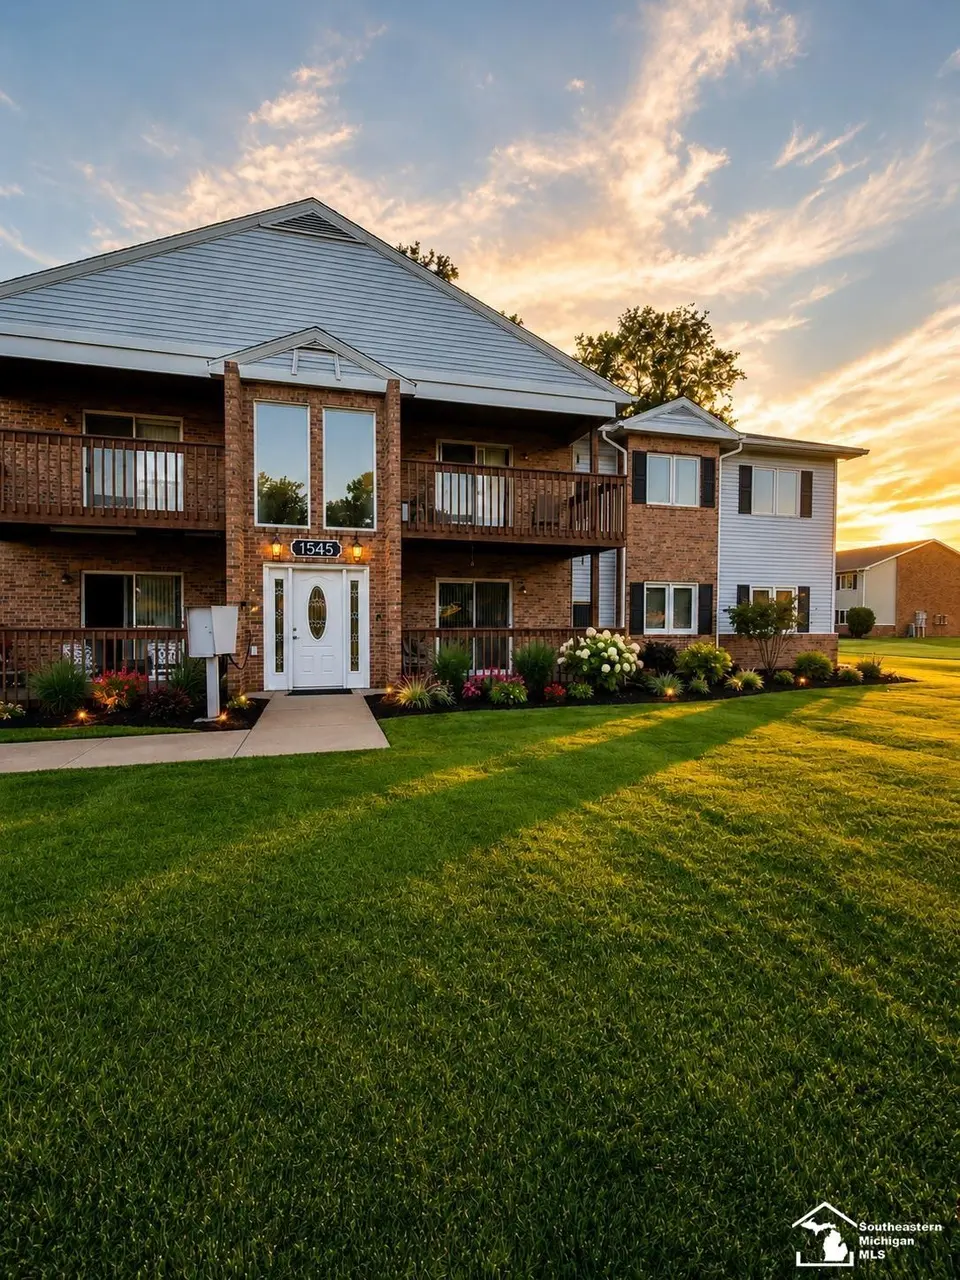
1545 Harbour Blvd #198
Trenton, MI 48183
$139,900D-
2 bd · 2.0 ba ·
1,072 sqft ·
Built 1991
· Condo
· Pending
· 7 DOM
Cashflow @ list (25.0% down · 7.5%)
Estimated rent
$1,402/mo
Mortgage (P&I)
−$734
Tax + insurance
−$220
HOA
−$220
Vac / Maint / Mgmt
−$294
Net cashflow
$-66/mo
Annual
$-788/yr
Cap rate
5.73%
Cash-on-cash
-2.01%
DSCR
0.91
1% rule
1.00%
Cash to close
$39,172
Investor read
- This is a 2-bed/2.0-bath condo listed at $140k.
- At list price, monthly cash flow is $-66 ($-788/yr) — negative.
- To cash-flow at today's rent, offer at most $128k (8.3% below list).
- Meets the 1% rule at list price ($1k rent vs $140k).
- Only 7 days on market — expect competitive offers; lowballing is unlikely to land.
- Recommended offer: $128k (8.3% below list) — sets the bar for cash-flow.
- Local home prices are declining (-3.0%/yr); year-one equity from $967 of loan paydown is wiped out by about $4k of value loss. Plan a longer hold.
- Location reads 88/100 on livability (#15 in MI, #250 nationally) — a professional / high-income tenant draw. Strengths: crime A+, cost of living A+, housing A+.
- Trenton Public Schools (suburban): math 44% / reading 53% proficiency, ranked #109 of 540 in MI (top 20%) — families likely to look elsewhere, expect single-tenant / working-renter base with shorter leases.
- Zoned schools: Jesse L Anderson Elementary School (math 52% / reading 58%, grade C, #271 of 1,397 statewide, top 20%, 582 students, 31% FRL); Boyd W Arthurs Middle School (math 40% / reading 53%, grade D+, #150 of 493 statewide, top 31%, 513 students, 32% FRL); Trenton High School (math 47% / reading 62%, grade C-, #109 of 713 statewide, top 17%, 892 students, 30% FRL).
- Market conditions: 184 active listings in the ZIP; 1 comparable units currently listed for rent nearby; solid renter incomes; 2,639 units permitted in Wayne County in 2024 (1,216 in 5+ unit buildings).
- Wayne County population projected at -17% by 2050 — secular population decline; favor cash flow + early exit over multi-decade hold.
- 3 sale attempts since 23y ago with the ask held roughly flat each time — persistent listings suggest the price (not the market) is what's stuck; bring a comps-based counter.
- Cap rate 5.7% vs local median 3.9% in Trenton — top-decile yield for the area; either an underpriced asset or a hidden risk that comps aren't pricing in. Stress-test before assuming the spread holds.
Questions for listing agent
- What do current leases actually rent for vs. the listed asking? Can we see a recent rent roll and the last 12 months of T-12 income?
- What does the HOA fee cover, when was the last increase, and are there any pending special assessments or reserve-fund shortfalls?
- Any open or pending special assessments — roof, HVAC, plumbing, elevator, façade? What's the per-unit balance and payoff schedule, and is the seller paying it off at close or rolling it to the buyer?
- Is there a deadline driving the sale (1031 exchange, divorce, estate, relocation)? That informs how much negotiation room exists.
- Schools are B-rated — typically a magnet for longer-tenancy family renters. What's the average tenant stay here, and is there a school-zone premium baked into asking?
- The area grade is low — what's the realistic commute time and amenity access for the typical tenant pool here? Any planned neighborhood developments (good or bad) we should know about?
- What's the average days-on-market for RENTAL listings here right now (not sales)? A rising rental-DOM trend means longer vacancies and softer asking-rent achievability than the comps imply.
- What's the recent tenant-quality profile in this submarket — average credit score on applications, eviction rate, late-payment / NSF rate, and stable-employment percentage? A property-management company in the area should have these aggregated.
CashFlowRE · CFR-E9YXKG0WDEKKVV
· Data 1 week ago
cashflowre.app · 2026-05-29